Read real time app data with .NET Aspire Dashboard in Azure Container Apps (preview)
The .NET Aspire Dashboard displays live data about how applications and other resources are running within an environment.
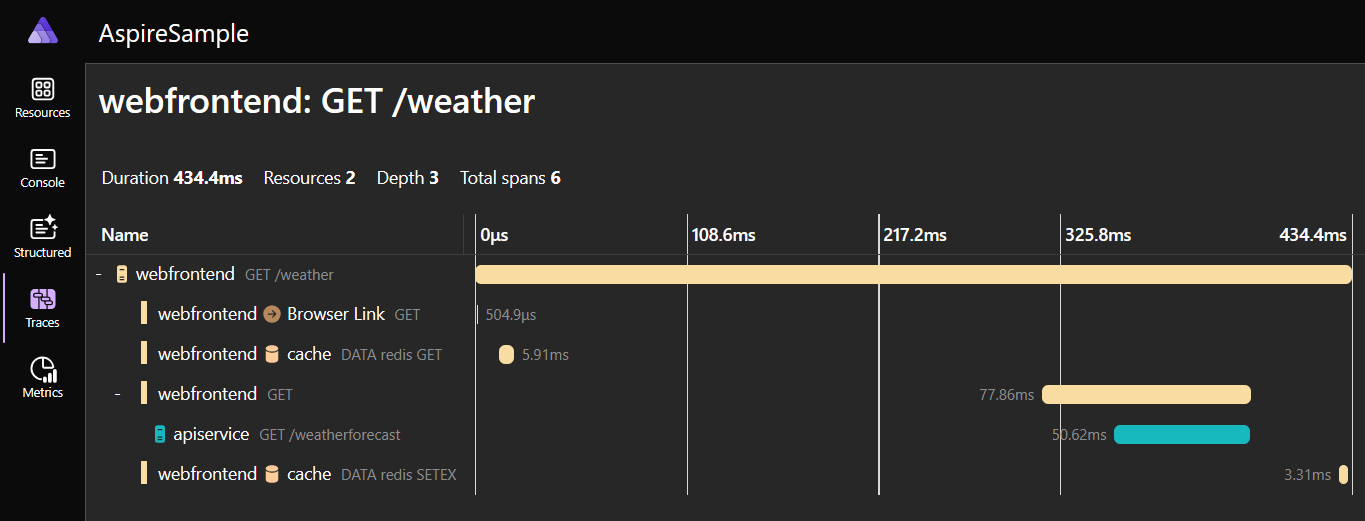
The following image is a screenshot of a trace visualization generated by the .NET Aspire Dashboard.
The information displayed on the dashboard comes from two sources:
OpenTelemetry (OTel), an open-source library for tracking traces, metrics, and logs for your applications. This documentation provides more information on how the Aspire dashboard integrates with OTel.
- Traces track the lifecycle of requests - how a request is received and processed as it moves between different parts of the application. This information is useful for identifying bottlenecks and other issues.
- Metrics are real-time measurements of the general health and performance of the infrastructure - for example, how many CPU resources are consumed and how many transactions that the application handles per second. This information is useful for understanding the responsiveness of your app or identifying early warning signs of performance issues.
- Logs record all events and errors that take place during the running of the application. This information is useful for finding when a problem occurred and correlated events.
The Kubernetes API provides information about the underlying Kubernetes pods on which your application is running on and their logs.
The dashboard is secured against unauthorized access and modification. To use the dashboard, a user must have 'Write' permissions or higher - in other words, they must be a Contributor or Owner on the environment.
Enable the dashboard
Tip
While you have the portal as an option, the recommended approach to enabling your dashboard is with azd. If you run into an problems using the portal, create an issue in the Container Apps GitHub repo.
You can enable the .NET Aspire Dashboard on any existing container app using the following steps.
Go to the Azure portal.
Open the Overview window of your container app.
Find the .NET Aspire Dashboard label, and select the enable link.
This action opens the .NET Aspire Dashboard settings window.
Next to the .NET Aspire Dashboard label, select the Enabled checkbox.
Now the .NET Aspire Dashboard URL is displayed to you.
Select the URL to your dashboard.
You can enable the .NET Aspire Dashboard on any existing container app environment by using the following commands.
az containerapp env dotnet-component create \
  --environment <ENVIRONMENT_NAME> \
  --name <CONTAINER_APP_NAME> \
  --resource-group <RESOURCE_GROUP_NAME>
The create command returns the dashboard URL that you can open in a browser.
You can enable the .NET Aspire Dashboard on any existing container app using the following steps.
dotnet new aspire-starter
azd init --location westus2
azd config set aspire.dashboard on
azd up
The up command returns the dashboard URL that you can open in a browser.
Troubleshooting
Refer to the following items if you have issues enabling your dashboard:
The portal can take up to two minutes for the dashboard to activate. If you try to go to the dashboard before it's ready, the server returns a
404or421error.If you encounter a
421"Misdirected Request" error, close the browser window, wait a few minutes, and try again.You might receive an authentication error when accessing the dashboard that reads, "Could not authenticate user with requested resource."
To solve this problem, make sure you grant the Microsoft.App/managedEnvironments/write, Contributor, or Owner roles on your Container Apps environment.