Network insights
Azure Monitor Network Insights provides a comprehensive and visual representation through topology, health and metrics for all deployed network resources, without requiring any configuration. It also provides access to network monitoring capabilities like Connection monitor, NSG flow logs, VNet flow logs, and Traffic analytics. Additionally, it provides access to Network Watcher diagnostic tools.
Azure Monitor Network Insights is structured around these key components of monitoring:
Topology
Topology provides a visualization of Azure virtual networks and connected resources for understanding network topology. Topology provides an interactive interface to view resources and their relationships in Azure across multiple subscriptions, regions, and resource groups. You can drill down to the resource view of an individual resource such as a virtual machine (VM) to see its traffic and connectivity insights and access network diagnostic tools to troubleshoot any network issues the VM is experiencing. To learn how to use Azure Monitor topology, see View topology.
Network health and metrics
The Azure Monitor network insights page provides an easy way to visualize the inventory of your networking resources, together with resource health and alerts. It's divided into four key functional areas: search and filtering, resource health and metrics, alerts, and resource view.
Search and filtering
To customize the resource health and alerts view in Network health tab, you can use the following filters: Subscription, Resource Group, and Type. Additionally, you can sort the resources by name or by resource count.
You can use the search box to search for resources and their associated resources. For example, searching for agwpip, which is a public IP associated with an application gateway returns the public IP and the associated application gateway:
Resource health and metrics
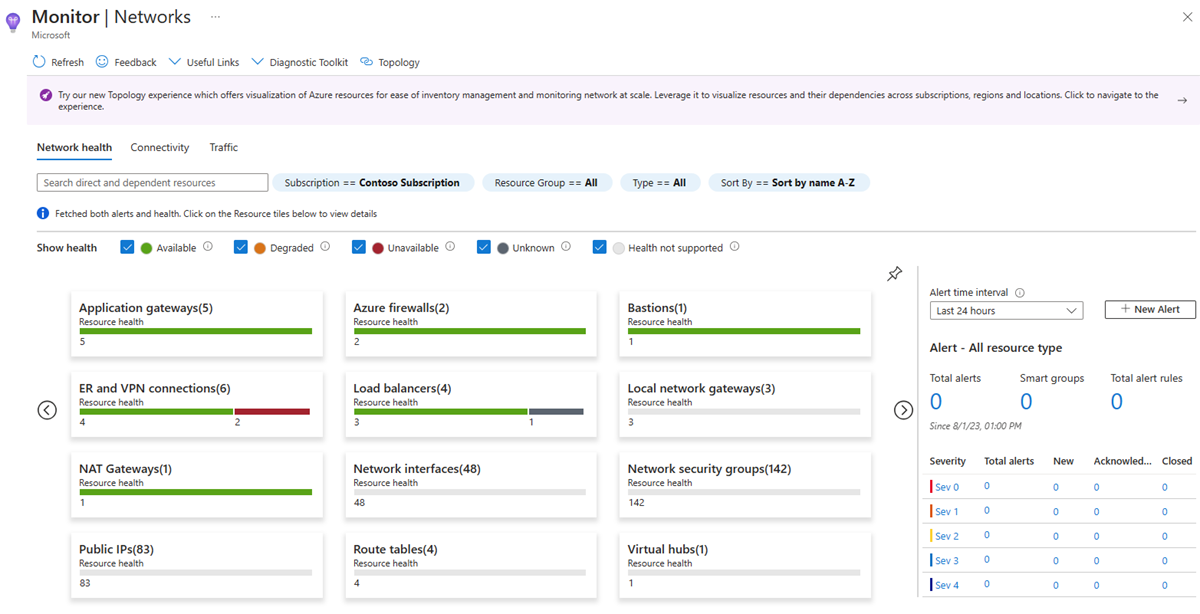
In Network health tab, you can view the health and metrics of all resources across selected subscriptions and resource groups. Each tile represents a resource type. It shows the number of instances of that resource type deployed across the selected subscriptions and resource groups. It also displays the health status of the resource. In the following example, there are 6 ExpressRoute and VPN connections deployed. 4 are healthy and 2 are unavailable.
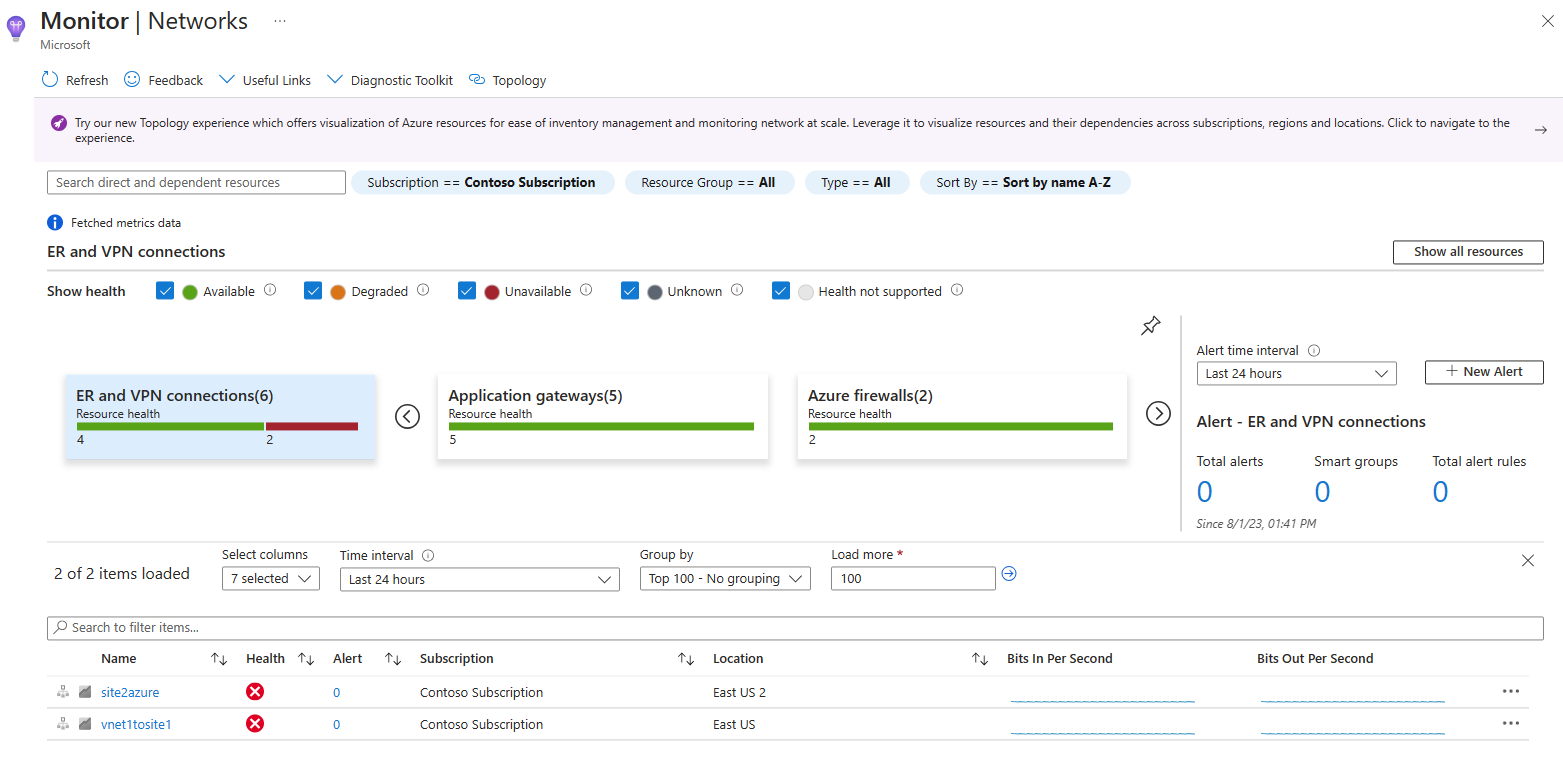
In ER and VPN connections tile, select the unavailable ExpressRoute and VPN connections to see their metrics:
To get the resource health of any of the unavailable connections, select the red icon next to the connection in the Health column. Select the value in the Alert column to go to the alerts and metrics page of the connection.
Alerts
The Alert box on the right side of the page provides a view of all alerts generated for a resource type across the selected subscriptions and resource groups. Select the alert counts to go to a detailed alerts page.
Resource view
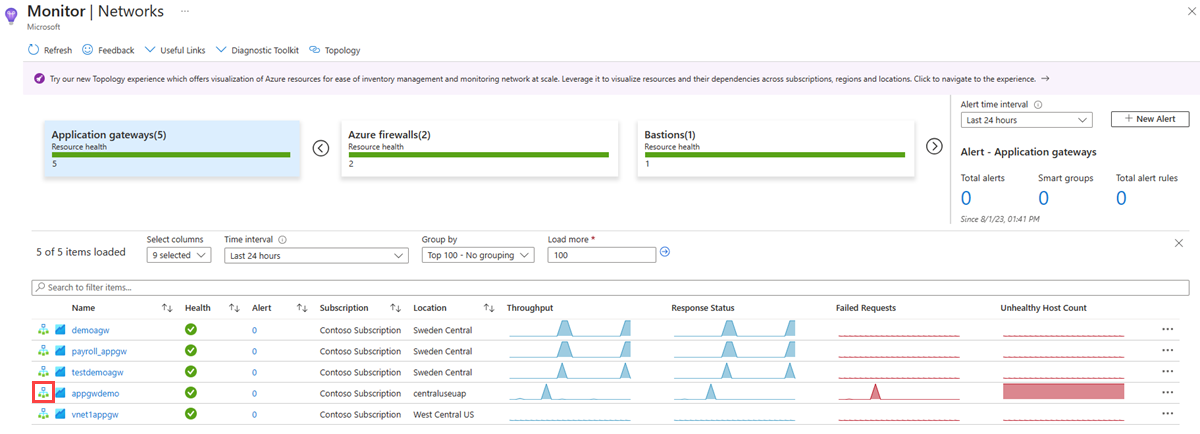
The resource view helps you visualize how a resource is configured. For example, to access the resource view of an application gateway, select the topology icon next to the application gateway name in the metrics grid view:
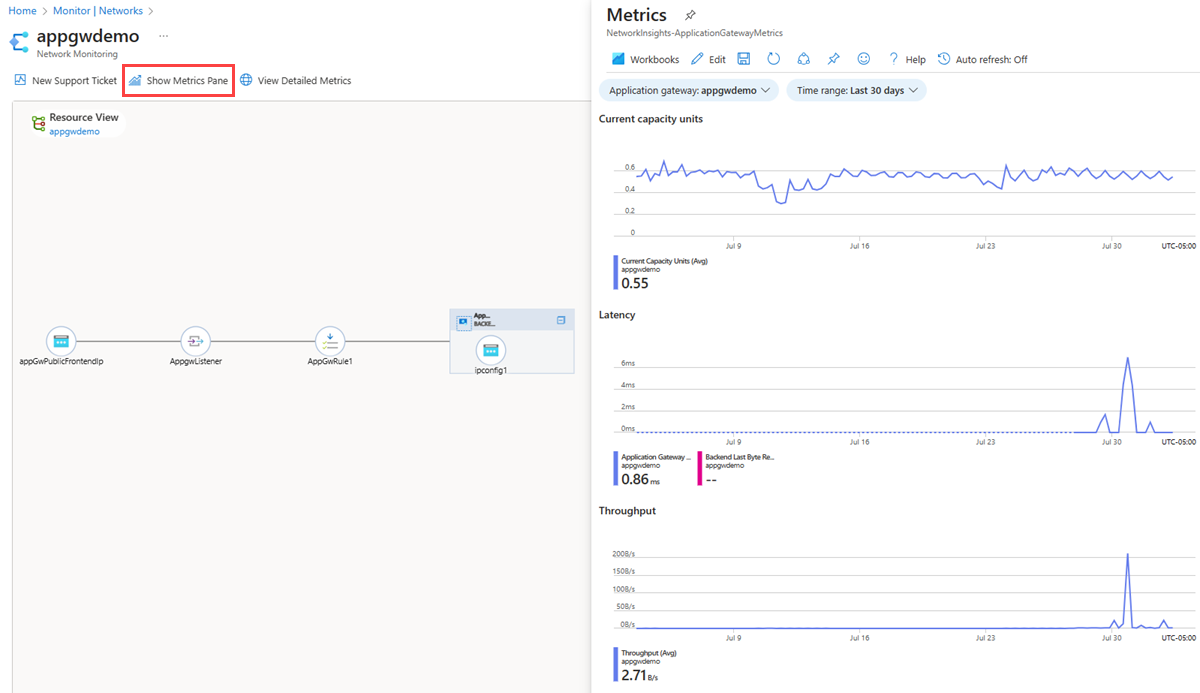
The resource view for the application gateway provides a simplified view of how the front-end IPs are connected to the listeners, rules, and backend pool. The connecting lines are color coded and provide additional details based on the backend pool health. The view also provides a detailed view of the application gateway metrics and metrics for all related backend pools, like virtual machines and virtual machine scale set instances:
The resource view provides easy navigation to configuration settings. Right-click a backend pool to access other information. For example, if the backend pool is a virtual machine (VM), you can directly access VM insights and Azure Network Watcher connection troubleshooting to identify connectivity issues.
Connectivity
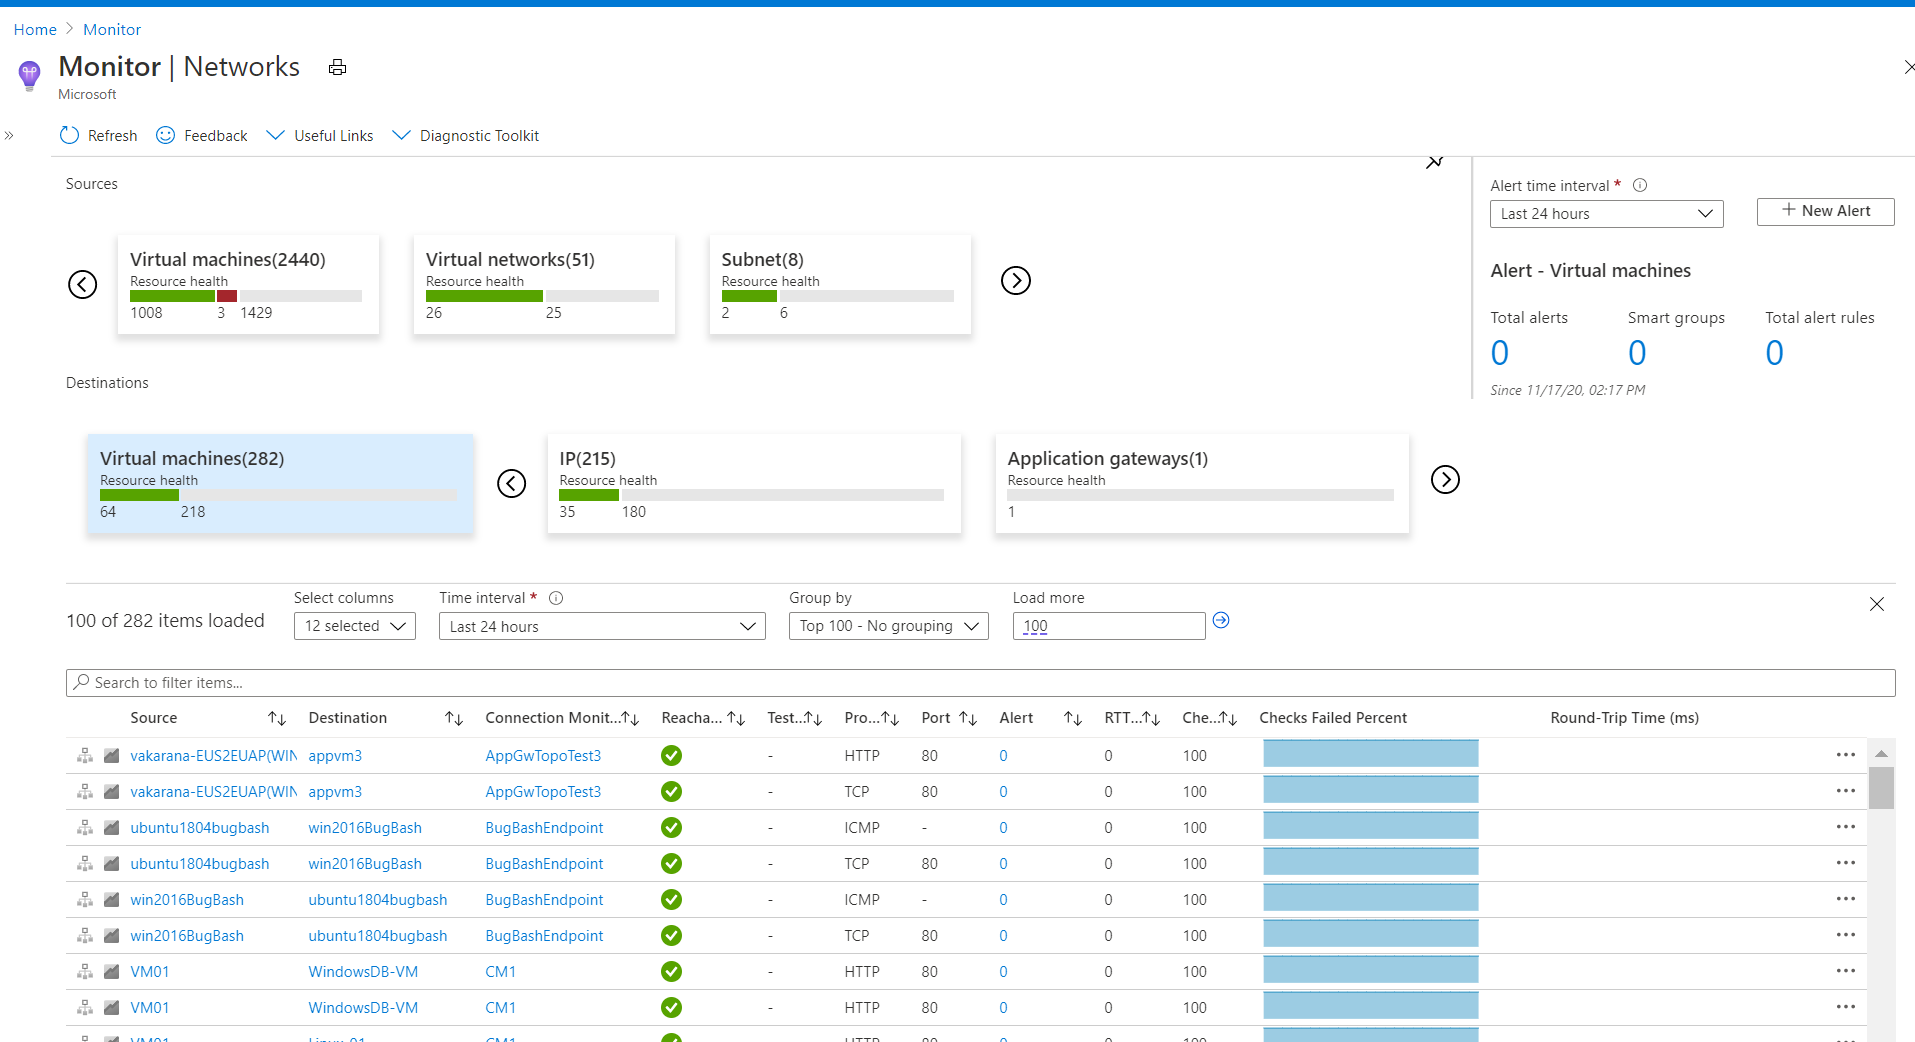
The Connectivity tab provides an easy way to visualize all tests configured via Connection monitor and Connection monitor (classic) for the selected set of subscriptions.
Tests are grouped by Sources and Destinations tiles and display the reachability status for each test. Reachable settings provide easy access to configurations for your reachability criteria, based on checks failed (%) and RTT (ms). After you set the values, the status for each test updates based on the selection criteria.
You can select any source or destination tile to open a metric view:
You can select any item in the grid view. Select the icon in the Reachability column to go to the Connection Monitor portal page and view the hop-by-hop topology and connectivity affecting issues identified. Select the value in the Alert column to go to alerts. Select the graphs in the Checks Failed Percent and Round-Trip Time (ms) columns to go to the metrics page for the selected connection monitor.
The Alert box on the right side of the page provides a view of all alerts generated for the connectivity tests configured across all subscriptions. Select the alert counts to go to a detailed alerts page.
Traffic
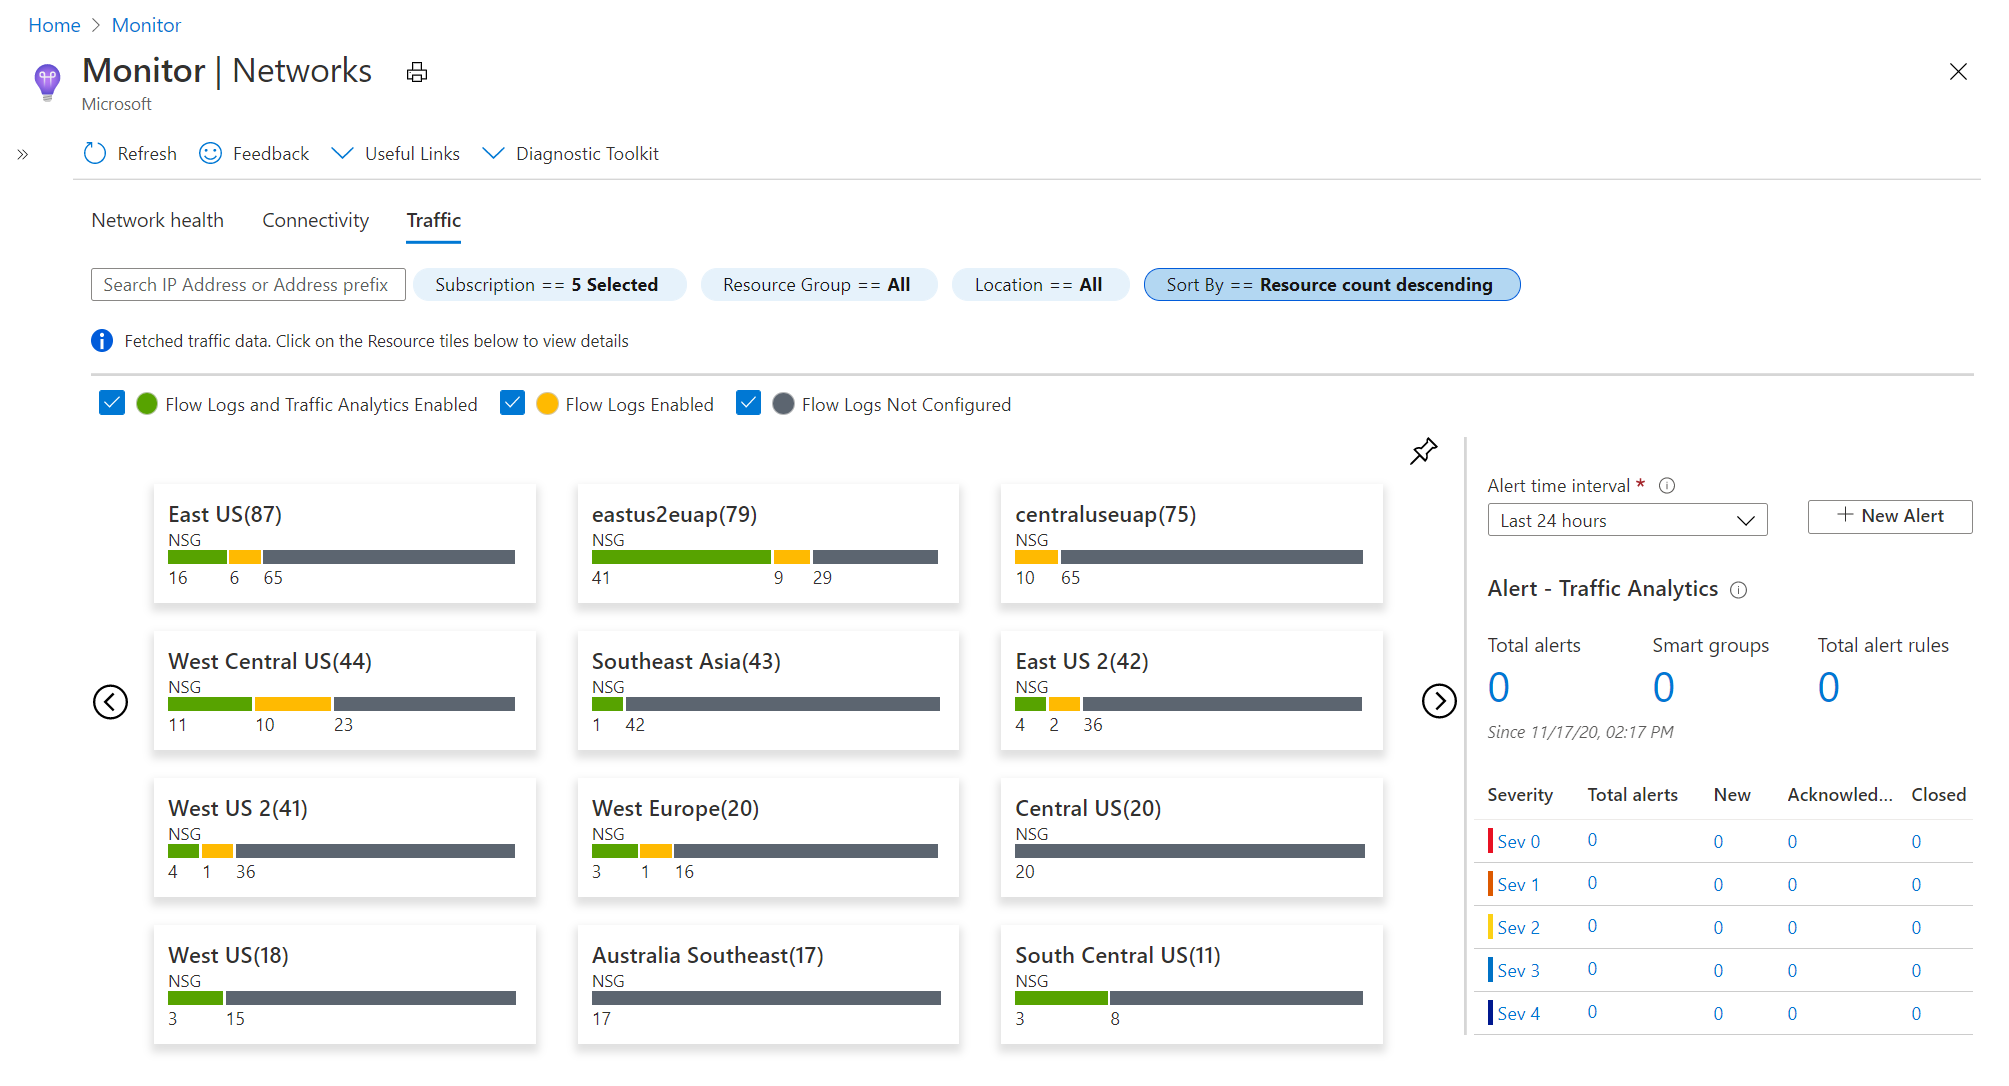
The Traffic tab lists all network security groups in the selected subscriptions, resource groups and locations and it shows the ones configured for NSG flow logs and Traffic analytics. The search functionality provided on this tab enables you to identify the network security groups configured for the searched IP address. You can search for any IP address in your environment. The tiled regional view displays all network security groups along with the NSG flow logs and Traffic analytics configuration status.
If you select any region tile, a grid view appears. The grid provides NSG flow logs and Traffic analytics in a view that's easy to read and configure:
You can select any item in the grid view. Select the icon in the Flowlog Configuration Status column to edit the NSG flow log and Traffic Analytics configuration. Select the value in the Alert column to go to the traffic alerts configured for the selected NSG. Similarly, you can go to the Traffic Analytics view by selecting the Traffic Analytics Workspace.
The Alert box on the right side of the page provides a view of all Traffic Analytics workspace-based alerts across all subscriptions. Select the alert counts to go to a detailed alerts page.
Diagnostic Toolkit
Diagnostic Toolkit provides access to all the diagnostic features available for troubleshooting the network. You can use this drop-down list to access features like packet capture, VPN troubleshoot, connection troubleshoot, next hop, and IP flow verify:
Availability of resources
By default, all networking resources are visible in Azure Monitor network insights. You can select the resource type for viewing resource health and metrics (if available), subscription details, location, etc. A subset of networking resources has been Onboarded. For Onboarded resources, you have access to a resource specific topology view and a built-in metrics workbook. These out-of-the-box experiences make it easier to explore resource metrics and troubleshoot issues.
Resources that have been onboarded are:
- Application Gateway
- Azure Bastion
- Azure Firewall
- Azure Front Door
- Azure NAT Gateway
- ExpressRoute
- Load Balancer
- Local Network Gateway
- Network Interface
- Network Security Group
- Private Link
- Public IP address
- Route table / UDR
- Traffic Manager
- Virtual Hub
- Virtual Network
- Virtual Network Gateway (ExpressRoute and VPN)
- Virtual WAN
Related content
- To learn more about network monitoring, see What is Azure Network Watcher?
- To learn about the scenarios workbooks are designed to support and how to create reports and customize existing reports, see Create interactive reports with Azure Monitor workbooks.


