Create a dashboard in Azure Managed Grafana
In this guide, learn how to create a dashboard in Azure Managed Grafana to visualize data from your Azure services.
A Grafana dashboard contains panels and rows. You can import a Grafana dashboard and adapt it to your own scenario, create a new Grafana dashboard, or duplicate an existing dashboard.
Note
The Grafana UI may change periodically. This article shows the Grafana interface and user flow at a given point. Your experience may slightly differ from the examples below at the time of reading this document. If this is the case, refer to the Grafana Labs documentation.
Prerequisites
- An Azure account with an active subscription. Create an account for free.
- An Azure Managed Grafana instance. If you don't have one yet, create an Azure Managed Grafana instance.
- Another existing Azure service instance with monitoring data.
Import a Grafana dashboard
To quickly create a dashboard, import an existing dashboard and add it to your Managed Grafana instance. You can do so by importing a dashboard template from Grafana Labs, uploading a JSON file or pasting JSON code.
Import a dashboard from Grafana Labs
Import a dashboard template from the Grafana Labs website.
From the Grafana Labs website, browse through Grafana dashboards templates and select a dashboard to import.
Select Copy ID to clipboard.
For the next steps, use the Azure portal or the Azure CLI.
In the Azure portal, open your Azure Managed Grafana workspace and select the Endpoint URL.
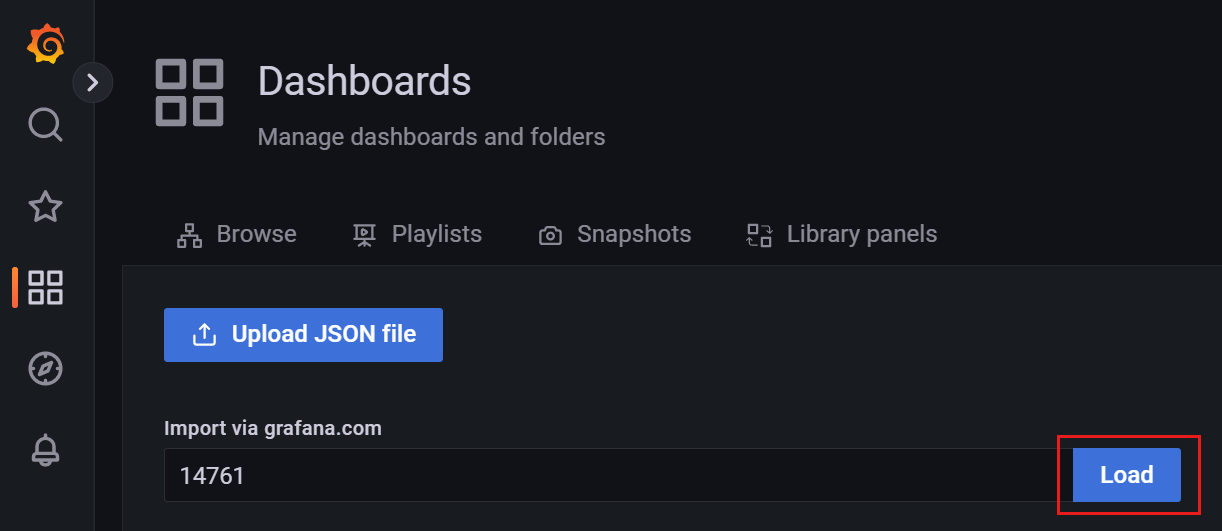
In the Grafana portal, go to Dashboards > Import.
Under Import via grafana.com, paste the Grafana dashboard ID copied earlier, and select Load.
Optionally update the dashboard name, folder, unique identifier (UID), and other parameters.
Select a datasource and select Import.
A new dashboard is displayed. Review and edit it if necessary.
Import a JSON dashboard
Follow these steps to import a JSON dashboard to Grafana:
- In the Azure portal, open your Azure Managed Grafana workspace and select the Endpoint URL.
- Go to Dashboard > Import use a preferred import option:
- Select Upload JSON file and then Load to import from a JSON file.
- Paste JSON text in the Import via panel json box and select Load to use text from your clipboard.
- Optionally update the dashboard name, folder, unique identifier (UID) and other parameters.
- Select Import.
Create a new Grafana dashboard
To create your own new dashboard, follow these steps.
In the Azure portal, open your Azure Managed Grafana workspace and select the Endpoint URL.
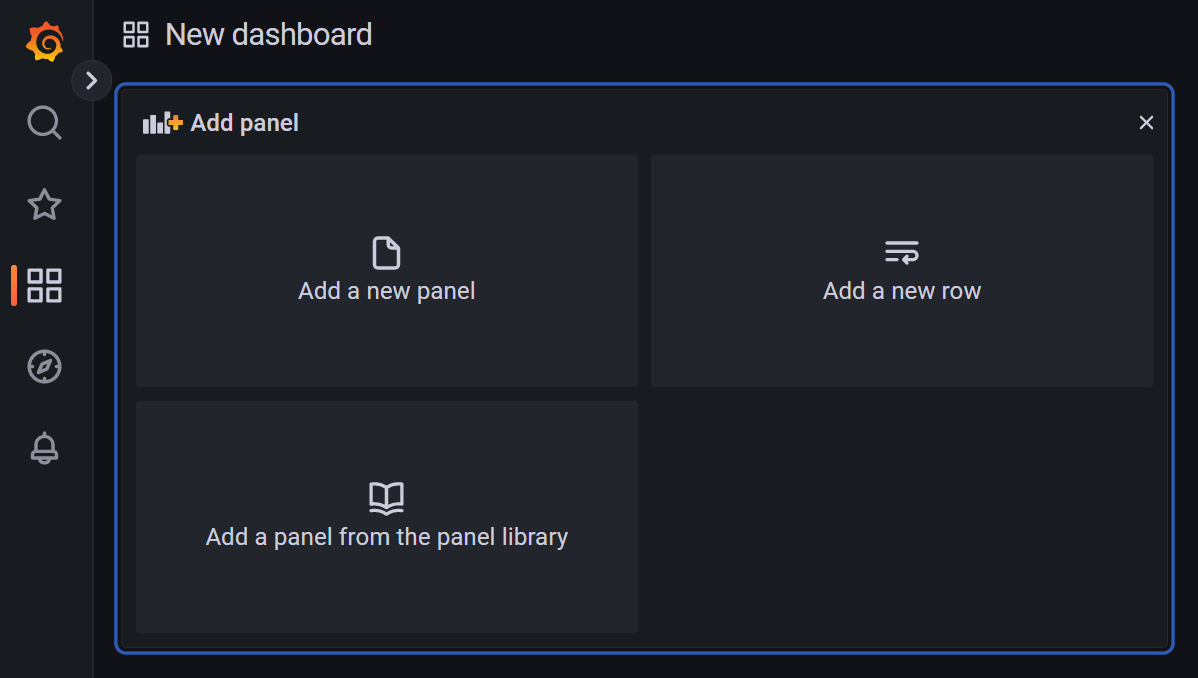
In the Grafana portal, go to Dashboards > New Dashboard.
Select one of the following options:
- Add a new panel: instantly creates a dashboard from scratch with a first default panel.
- Add a new row: instantly creates a dashboard with a new empty row.
- Add a panel from the panel library: instantly creates a dashboard with an existing reusable panel from another instance you have access to.
Duplicate a Grafana dashboard
Duplicate a Grafana dashboard using your preferred method.
To copy a Grafana dashboard:
Open an existing dashboard in your Grafana instance.
Select Dashboard settings.
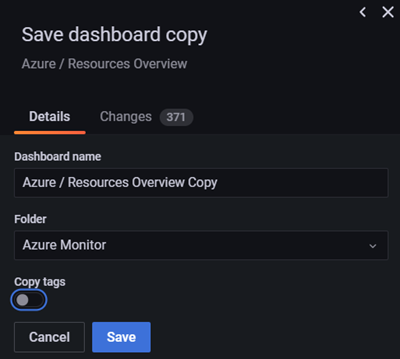
Select Save as.
Enter a new name and/or a new folder and select Save.
Edit a dashboard panel
Edit a Grafana dashboard panel using your preferred method.
To update a Grafana panel, follow the steps below.
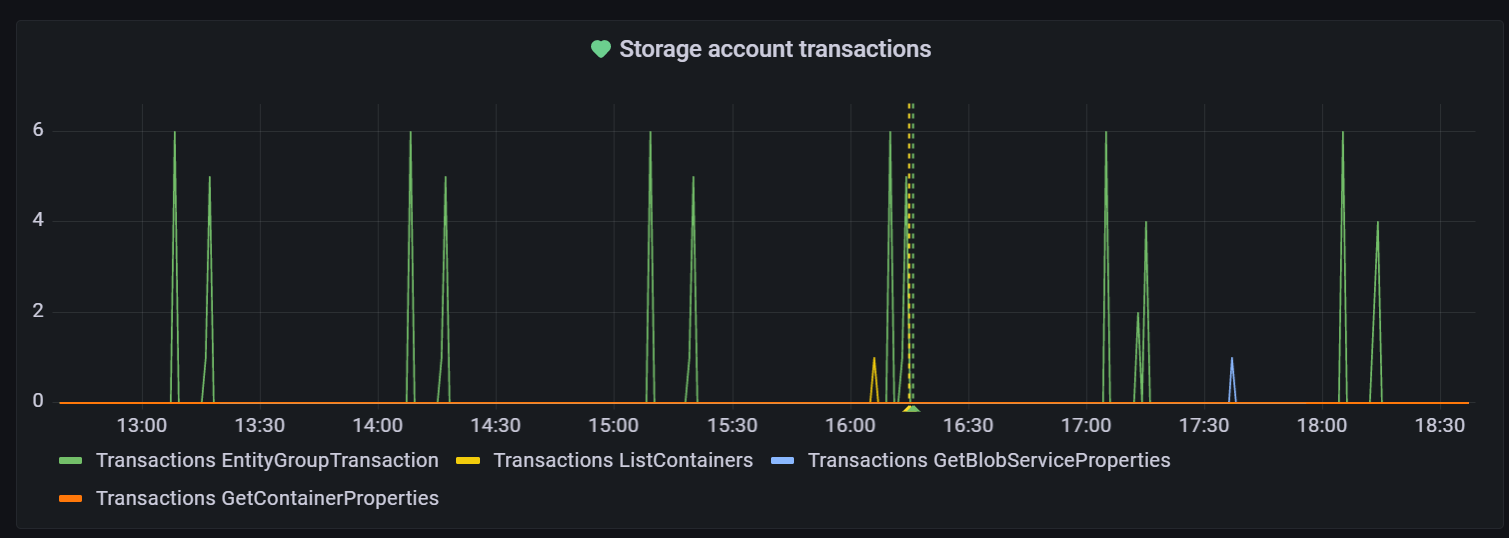
Review the panel to check if you're satisfied with it or want to make some edits.
In the lower part of the page:
- Query tab:
- Review the selected data source. If necessary, select the drop-down list to use another data source.
- Update the query. Each data source has a specific query editor that provides different features and capabilities for that type of data source.
- Select + Query or + Expression to add a new query or expression.
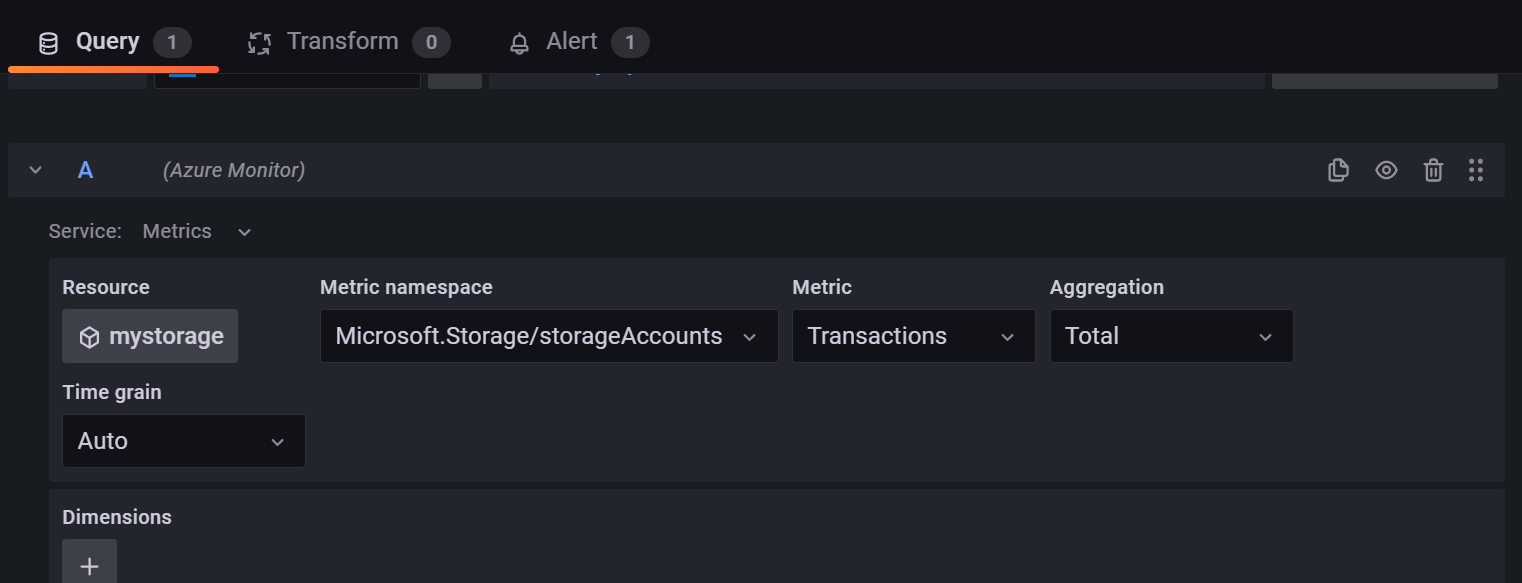
- Transform tab: filter data or queries, and organize or combine data before the data is visualized.
- Alert tab: set alert rules and notifications.
- Query tab:
At the top of the page:
- Toggle Table view to display data as a table.
- Switch between Fill and Actual to edit panel size.
- Select the time icon to update the time range.
- Select the visualization drop-down menu to choose a visualization type that best supports your use case. Go to visualization for more information.

On the right hand side, select the Panel options icon to review and update various panel options.
Next steps
In this how-to guide, you learned how to create a Grafana dashboard. To learn share this dashboard with internal and external stakeholders, go to:
Feedback
Coming soon: Throughout 2024 we will be phasing out GitHub Issues as the feedback mechanism for content and replacing it with a new feedback system. For more information see: https://aka.ms/ContentUserFeedback.
Submit and view feedback for