Note
Access to this page requires authorization. You can try signing in or changing directories.
Access to this page requires authorization. You can try changing directories.
When contacting support, you might be asked to provide the output package of the Microsoft Defender for Endpoint Client Analyzer tool.
This article provides instructions on how to run the tool via Live Response on Windows and on Linux machines.
Windows
Download and fetch the required scripts available from within the Tools subdirectory of the Microsoft Defender for Endpoint Client Analyzer.
For example, to get the basic sensor and device health logs, fetch
..\Tools\MDELiveAnalyzer.ps1.- If you require additional logs related to Microsoft Defender Antivirus, then use
..\Tools\MDELiveAnalyzerAV.ps1. - If you require Microsoft Endpoint Data Loss Prevention related logs, then use
..\Tools\MDELiveAnalyzerDLP.ps1. - If you require network and Windows Filter Platform related logs, then use
..\Tools\MDELiveAnalyzerNet.ps1. - If you require Process Monitor logs, then use
..\Tools\MDELiveAnalyzerAppCompat.ps1.
- If you require additional logs related to Microsoft Defender Antivirus, then use
Initiate a Live Response session on the machine you need to investigate.
Select Upload file to library.

Select Choose file.
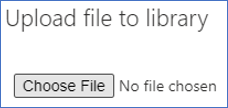
Select the downloaded file named
MDELiveAnalyzer.ps1, and then select on Confirm.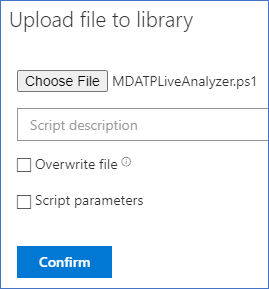
Repeat this step for the
MDEClientAnalyzerPreview.zipfile.While still in the LiveResponse session, use the following commands to run the analyzer and collect the resulting file.
Putfile MDEClientAnalyzerPreview.zip
Run MDELiveAnalyzer.ps1
GetFile "C:\ProgramData\Microsoft\Windows Defender Advanced Threat Protection\Downloads\MDECA\MDEClientAnalyzerResult.zip"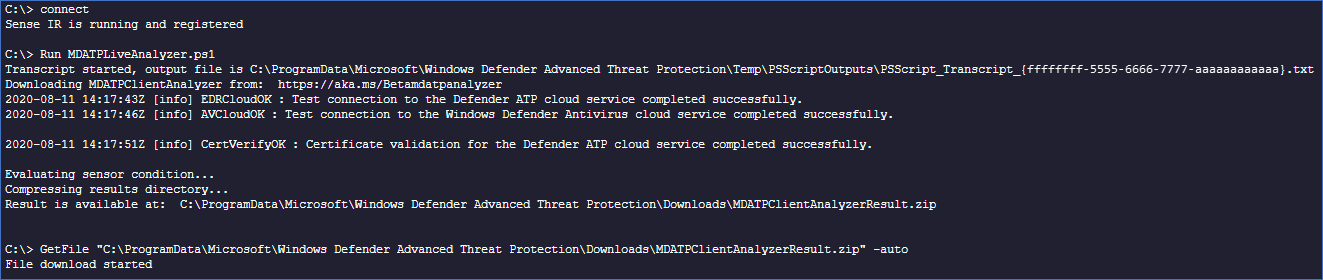
Additional information
The latest preview version of MDE Client Analyzer can be downloaded at https://aka.ms/MDEClientAnalyzerPreview.
For more information on gathering data locally on a machine in case the machine isn't communicating with Microsoft Defender for Endpoint cloud services, or doesn't appear in Microsoft Defender for Endpoint portal as expected, see Verify client connectivity to Microsoft Defender for Endpoint service URLs.
As described in Live response command examples, you might want to use the
&symbol at the end of the command to collect logs as a background action:Run MDELiveAnalyzer.ps1&
Linux
Use either the binary Live Response action pair, which doesn't require Python, or the Python action pair. Each installer downloads and validates the required Client Analyzer package on the device.
Prerequisites
- The binary actions require
curl,find,mktemp,od,sha256sum,stat,unzip, and standard POSIX shell utilities. They don't requirepython3. - The Python actions require
python3in addition to the common prerequisites. - The device must be able to reach the Microsoft download endpoint over HTTPS. If it can't, use the local workflow in Run the client analyzer on Linux with a package location that the device can reach.
Choose one of the following workflows for the collection.
Option 1: Binary Client Analyzer
Install the binary Client Analyzer
Download the two binary action files:
If you prepare the action files on Windows, convert them to Unix line endings.
Upload both files to the Live Response library. Each action is self-contained.
Start a Live Response session, and run the installer without parameters:
run InstallXMDEClientAnalyzer.shCopy the workspace ID printed by the installer. It has the format
mde-client-analyzer-binary-followed by 16 lowercase hexadecimal characters.
Run the binary Client Analyzer
Run the matching support action with exactly the workspace ID from the installer:
run MDESupportTool.sh -parameters "mde-client-analyzer-binary-<workspace-id>"
The action selects the appropriate amd64 or arm64 package and starts diagnostic collection.
Option 2: Python Client Analyzer
Install the Python Client Analyzer
Download the two Python action files:
If you prepare the action files on Windows, convert them to Unix line endings.
Upload both files to the Live Response library. Each action is self-contained.
Start a Live Response session, and run the installer without parameters:
run InstallXMDEPythonClientAnalyzer.shCopy the workspace ID printed by the installer. It has the format
mde-client-analyzer-python-followed by 16 lowercase hexadecimal characters.
Run the Python Client Analyzer
Run the matching support action with exactly the workspace ID from the installer:
run MDEPythonSupportTool.sh -parameters "mde-client-analyzer-python-<workspace-id>"
The action starts diagnostic collection.
Retrieve the diagnostic package
The runner prints its private run-directory path before it starts the Client Analyzer. After the action finishes, retrieve the generated diagnostic archive from that directory. Use the archive filename reported by the analyzer.
Client Analyzer run directory: /var/tmp/<workspace-id>/runs/run-<run-id>
GetFile "<run-directory>/<diagnostic-archive>.zip"
Successful workspaces aren't automatically removed by these actions, and the actions don't define a fixed cleanup interval. Retrieve the archive promptly, and follow your organization's /var/tmp retention and cleanup policy. If the analyzer reports an error, use the error output and the Run the client analyzer on Linux guidance to troubleshoot the device.
Security and lifecycle
- The installer creates a randomized private workspace below
/var/tmp, validates the downloaded package and entrypoint, and writes a completion record only after setup succeeds. - The runner revalidates the workspace, completion record, ownership, permissions, and entrypoint digest immediately before execution.
- Rerun the installer if the workspace is removed by a local cleanup policy or the runner reports a validation failure.
- Replace both action files for the selected package in the Live Response library when a new version is published. Previously uploaded files and downloaded packages don't update automatically.
This guidance applies only to Linux Live Response actions.