Note
Access to this page requires authorization. You can try signing in or changing directories.
Access to this page requires authorization. You can try changing directories.
Important
This feature is part of the Frontier preview program. Frontier connects you directly with Microsoft's latest AI innovations. Frontier previews are subject to the existing preview terms of your customer agreements. As these features are still in development, their availability and capabilities might change over time.
The Cost & forecast page in Business Analytics helps you monitor usage-based AI costs, understand what's causing spending to change, compare current and projected spending with budget targets, and identify users or spending policies that are approaching their limits.
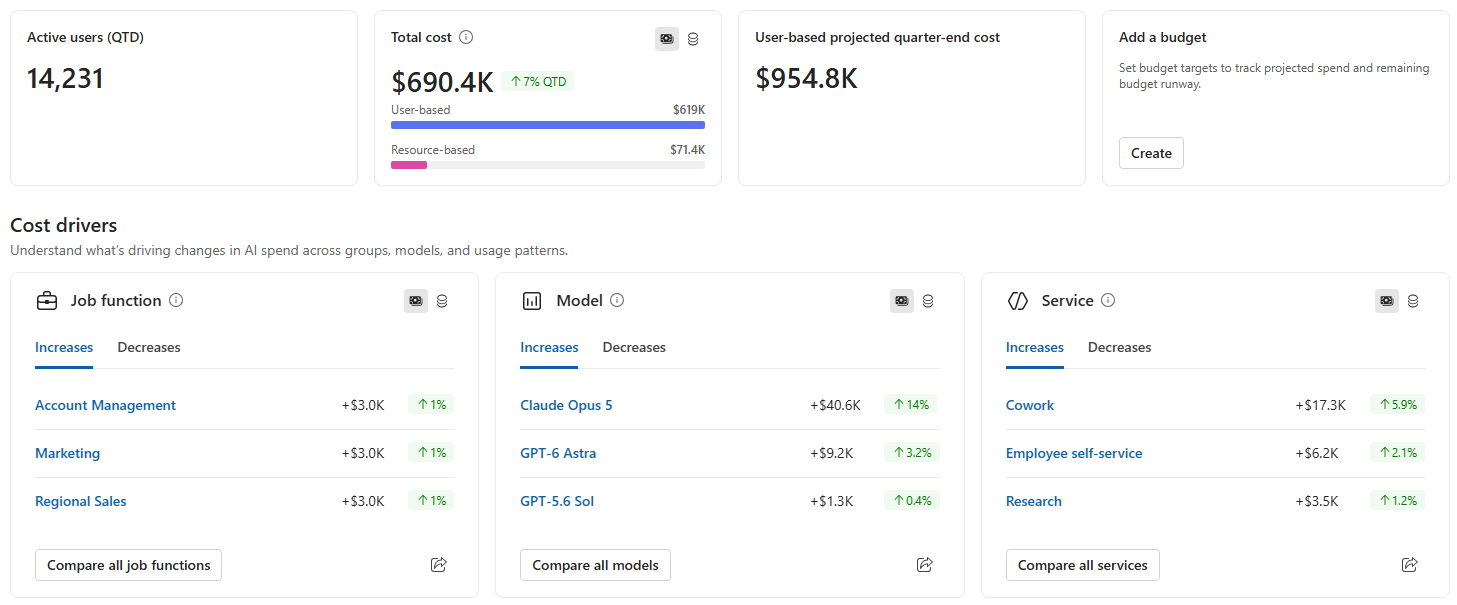
Use the page to answer questions such as:
- How much has my organization spent on usage-based AI services?
- Which services, models, groups, or job functions are driving changes in cost?
- Is current spending likely to exceed the available budget?
- Which users or spending policies are approaching or have reached a limit?
- How is cost distributed across services, models, and use cases?
Note
The Cost & forecast page focuses on usage-based billing. Microsoft Copilot user subscription license costs aren't included.
Prerequisites
Some sections or options appear only when the necessary data is available:
Spending policy filter options are available if you have permission to view whole-company spending data.
The Spending limits section appears only when at least one user limit or spending policy applies to the selected scope.
The Users tab under Spending limits appears when user limits are assigned and your role permits access.
The Policies tab appears when policy limits are assigned and your role permits access.
Minimum group size requirements apply throughout the page. Data that doesn't meet your organization's minimum group size threshold isn't shown.
Select the filters for your analysis
Use the filters at the top of the page to determine which population and spending data are included in the analysis. Available filters can include:
- Time period
- Spending policy
- Manager hierarchy
- Services & agents
- Organization
- Job function
- Other organizational attributes configured for your tenant
The default time period is month to date. Other available reporting periods can include quarter to date, year to date, and a custom or other supported period.
Most sections update when you change the time period or population filters.
When you select a spending policy, the page uses the policy's spending limit when calculating budget consumption, projected cost, and budget runway.
Review the summary cards
The cards at the top of the page summarize cost and activity for your chosen filters.
Active users shows the number of people who used an included usage-based AI service during the selected period.
Use this card to understand the population associated with the cost and usage shown elsewhere on the page.
Total cost shows the usage-based AI cost for the selected period. The card can separate user-based and resource-based cost when both cost types apply.
A percentage indicator shows how cost changed relative to the comparison period. At the top right of the card, select Total cost or Total credits to switch between monetary cost and Copilot Credits.
When a budget applies, the card can also show how much of the budget has been consumed.
Projected cost estimates the user-based cost at the end of the selected time period, based on recent usage.
Use this card to identify whether current spending patterns are likely to remain within the available budget. When a budget target or policy limit applies, the card can indicate whether projected cost is under or over that amount.
Forecast values are estimates and aren't a guarantee of future cost.
Add a budget
If no reporting budget has been configured, the Add a budget card lets you create a budget target for the organizational scope you can access.
To create a target:
- On the card, select Create.
- Enter the budget amount.
- Select Save budget target.
The saved target is used to calculate budget consumption and budget runway and to provide a budget reference in the cost over time visualization.
A reporting budget target helps you analyze spending. Creating the target doesn't configure a spending policy or enforce a spending limit.
Identify cost drivers
The Cost drivers section identifies the areas contributing to increases or decreases in AI spending between the current and comparison periods.
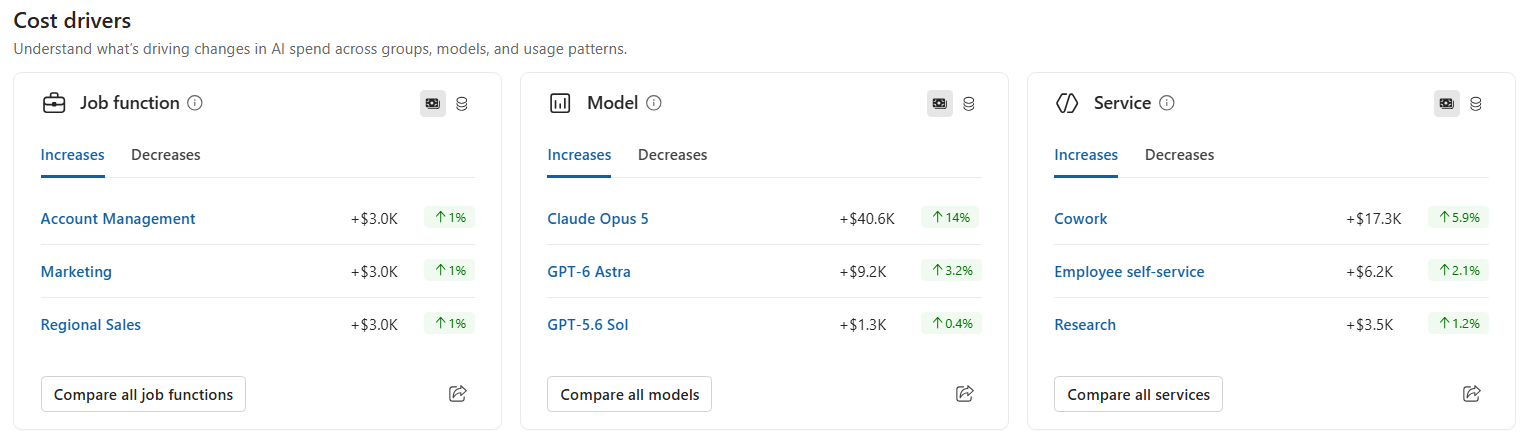
Depending on the data available for your scope, cards can include:
- Job function
- Model
- Service
- Organization
- Group
Each card contains two tabs:
Increases shows the three items contributing the largest cost increases.
Decreases shows the three items contributing the largest cost decreases.
Each row shows the cost driver, the monetary change, and the percentage change. Select a row or select Compare all to inspect the complete comparison for that driver.
In the comparison view, you can:
Review the prior- and current-period values
Sort by the largest increase or decrease
Review changes in cost and active users
Switch to another dimension by using View by
Switch between cost and credits where supported
Use this section to find the most significant source of a spending change before investigating the relevant service, model, organization, or group in more detail.
Analyze cost and credits over time
The Cost and credits over time section combines historical spending with projected cost. Use the controls above the visualization to change the measure, aggregation, and forecast type.
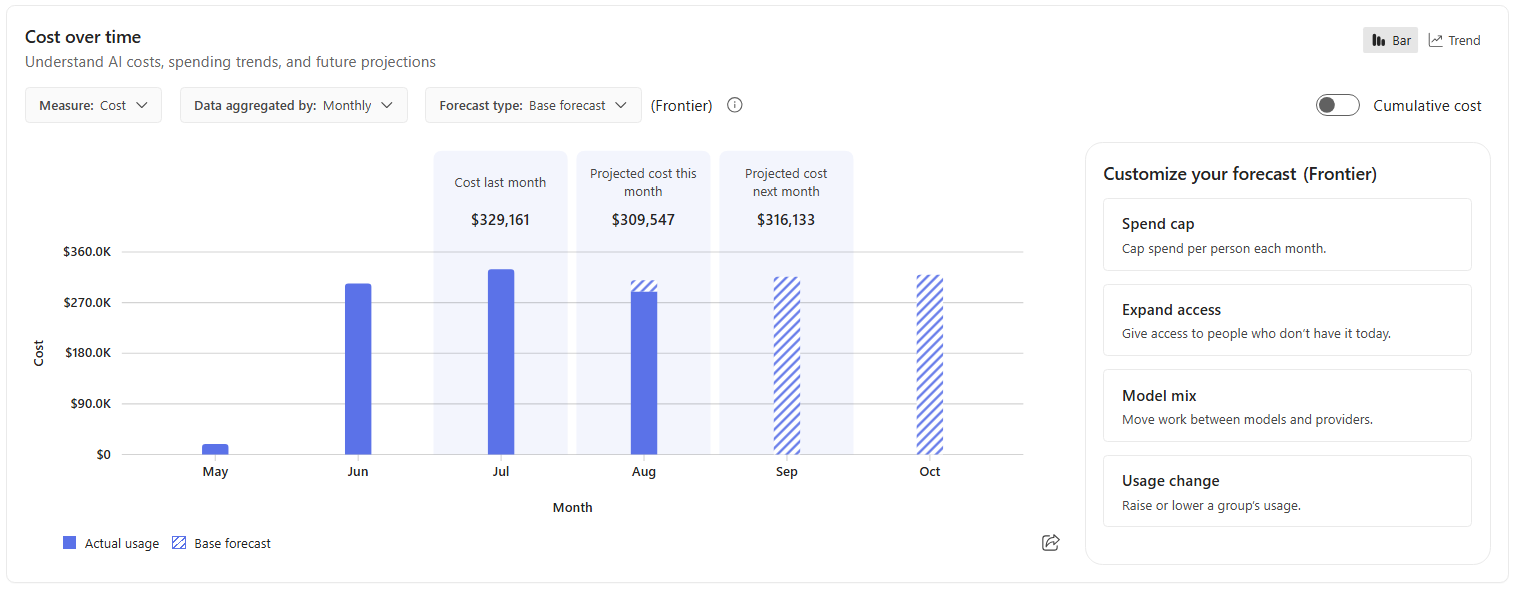
The visualization distinguishes recorded and projected data:
Solid bars or lines represent actual usage
Patterned bars or dotted lines represent forecast usage
A budget reference appears when a spending-policy limit or reporting budget target applies
Use Data aggregated by to switch between the available time-grouping options. Use the visualization options to switch between a bar view and trend view. On the right, turn on Cumulative cost to see how total cost builds over time rather than viewing each period separately.
Forecast options can include:
Base or steady forecast, which assumes future usage is consistent with recent usage.
Growth forecast, which allows recent usage growth to continue in the projection.
The cost-over-time analysis is independent of the page-level time-period filter so that it can include historical data and future projections.
How to customize the forecast
Use the options to the right of the chart to explore how possible changes could affect projected cost:
Spend cap: Estimate the impact of applying a monthly spending cap
Model mix: Estimate the impact of shifting usage between models or providers
A scenario changes only the forecast comparison. It doesn't modify live access, model routing, spending policies, budgets, or user limits.
Explore the cost breakdown
The Cost breakdown section shows how usage-based spending is distributed across services, models, and use cases.
At the top right, use the percentage and numeric controls to switch between proportional and absolute values.
Combined view
The Combined view shows the relationship between two dimensions in a flow diagram.
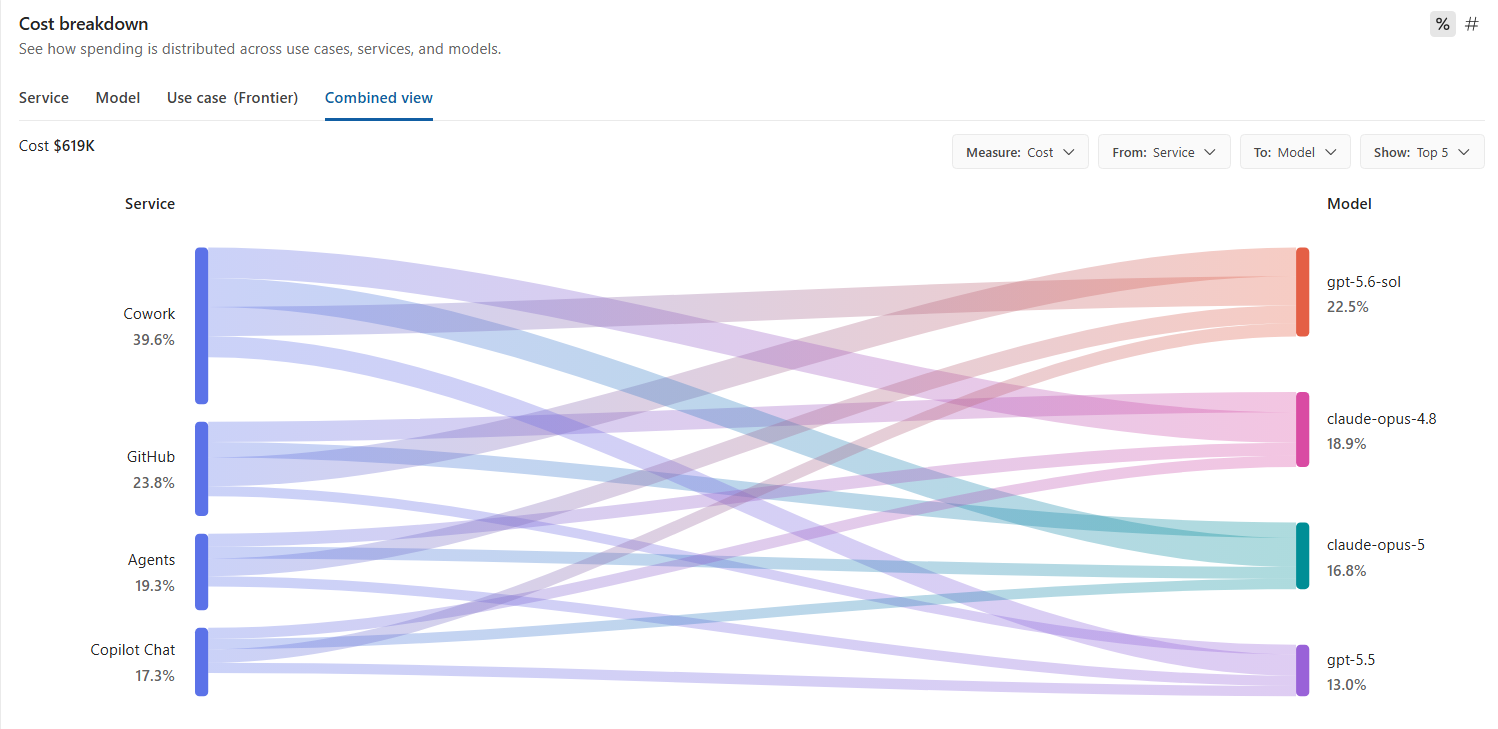
Use the controls above the visualization to select:
The measure you want to analyze
The starting dimension under From
The destination dimension under To
The number of items to display
For example, select Service under From and Model under To to see which models account for the cost generated by each service. The width of each connecting flow represents that relationship's share of the selected measure.
Use this view to identify concentrations or relationships that might not be apparent in a standard table.
Service
The Service tab shows how cost is distributed across AI services. A summary chart shows each service's share of total cost, and the table provides detailed metrics such as:
- Active users
- Sessions
- Cost
- Cost per session
- Total credits
Model
The Model tab shows cost and activity by model provider. Expand a provider to see the models included beneath it.
Available metrics can include:
- Active users
- Sessions
- Cost
- Cost per session
- AI value, when available
Use the table, heatmap, or trend options to compare providers and models from different perspectives.
Track spending limits
Note
Spending limits are applied monthly. This view uses the latest available month to date data even if the page time period filter exceeds a one month period.
The Spending limits section helps you identify users and policies that are approaching or have reached their configured limits. The section appears only when limit data exists for the current scope.
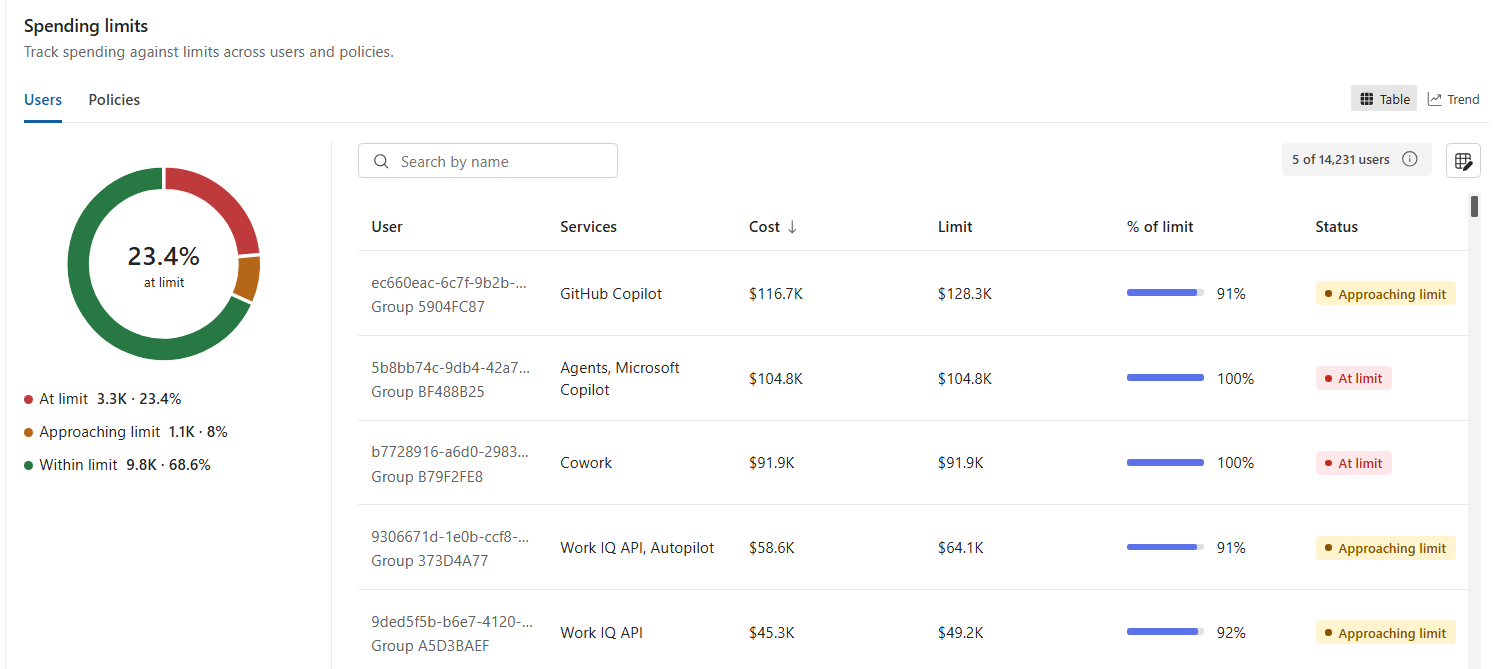
The summary chart groups users or policies into these categories:
At limit
Approaching limit
Within limit
Use the chart for an overall view and the adjacent table to identify the specific users or policies that require attention.
Users
The Users tab shows people who have an assigned usage limit.
The table includes:
- User
- Services
- Cost
- Limit
- Percentage of limit
- Status
By default, the list is ordered by cost. Use Search by name to find a specific user, or sort the table to prioritize users closest to their limit.
User-level rows don't include an individual forecast or runway. The status reflects the user's current cost relative to the assigned limit.
Policies
The Policies tab summarizes limits for spending policies.
The table includes:
- Spending policy
- Covered services
- Cost
- Limit
- Percentage of limit
- Forecast
- Runway
Forecast estimates the cost for the population covered by the policy. Runway estimates the time remaining before projected cost reaches the policy limit.
A spending policy can include users outside your authorized data scope. The table shows cost and forecast information only for the population you're authorized to view, while the displayed policy limit applies to the entire policy.
How to use the page to make decisions
The following examples show how you can use the Cost & forecast page.
| Goal | Where to look |
|---|---|
| Determine whether spending is likely to remain within budget | Review Projected cost, the budget target, and Cost over time. |
| Explain why cost increased | Start with the Increases tab in Cost drivers, and then open Compare all for the relevant dimension. |
| Identify costly services or models | Use the Service and Model tabs under Cost breakdown. |
| Understand relationships between services, models, and use cases | Use Combined view and select the dimensions you want to compare. |
| Find users close to their limits | Open Spending limits > Users, and review the percentage-of-limit and status columns. |
| Review the health of spending policies | Open Spending limits > Policies, and compare cost, forecast, and runway with each policy limit. |
| Evaluate a possible operational change | Apply a custom scenario in Cost over time and compare the result with the baseline forecast. |
Data and forecast considerations
Keep these considerations in mind when interpreting the page:
Forecasts are estimates based on recent usage. Sudden changes in usage or small group sizes can reduce accuracy.
Treat forecasts as a guide, not a guarantee of future costs.
Creating a reporting budget target doesn't create or modify an enforced spending policy.
Applying a forecast scenario doesn't change actual policies, limits, or access.