Note
Access to this page requires authorization. You can try signing in or changing directories.
Access to this page requires authorization. You can try changing directories.
Important
This feature is part of the Frontier preview program. Frontier connects you directly with Microsoft's latest AI innovations. Frontier previews are subject to the existing preview terms of your customer agreements. As these features are still in development, their availability and capabilities might change over time.
Ask Interactive insights a business question and get an answer with charts, a web report, or a PowerPoint presentation. It analyzes your available Agent 365 Business Analytics data to explain AI cost, usage, and adoption, and creates outputs for the audience and decision you have in mind.
Use Interactive insights when you want to investigate a custom business question, explore a finding through follow-ups, or prepare an output tailored to a particular audience and decision.
Interactive insights prepares analysis and recommendations. It doesn't change budgets, billing, policies, licenses, or permissions, contact people, or set up ongoing monitoring or make operational changes in the relevant authorized management experience.
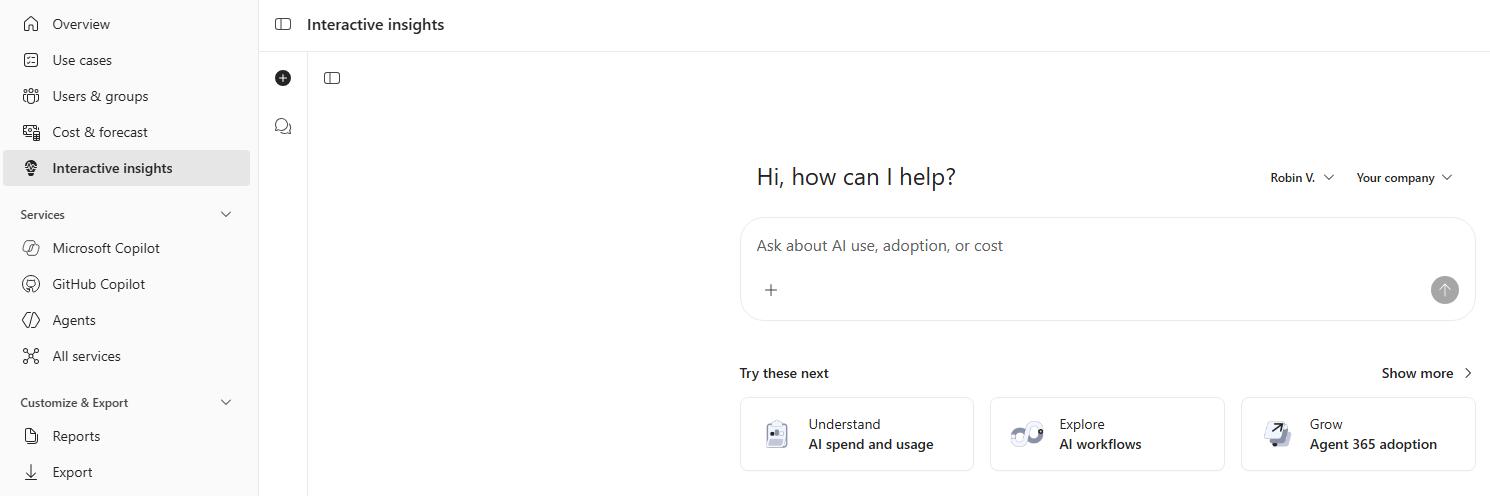
What you can explore
Explore AI consumption and AI service usage and adoption in detail with natural language questions.
AI consumption
| Page | Example request |
|---|---|
| Use cases | "Using the available use case data, show where AI is being used across our organization and identify areas for discussion in our adoption review." |
| Cost & forecast | "Explain this month's AI cost drivers and project next month's cost if the current pace continues. Compare cost with activity and state the forecast assumptions." |
| Users & groups | "Show which teams account for the largest changes in AI cost and activity. Prepare a brief for our budget review." |
Services
| Service | Example request |
|---|---|
| Microsoft Copilot | "Identify teams with sustained growth in Copilot usage over the last two complete months. Focus on bright spots we can discuss with our adoption leads." |
| GitHub Copilot | "Compare GitHub Copilot activity and cost across teams, and summarize the trends for our engineering leadership review." |
| Agents | "Show which agents are gaining repeat users and where activity is concentrated. Prepare a concise brief for our monthly agent portfolio review." |
Data used by Interactive insights
Interactive insights can use:
Scenario metrics: the metrics data underlying the Business Analytics scenarios, subject to your access.
Approved organizational and employee attributes: an allowlist of well-known attributes such as Organization, Function, Group, and Location. Sensitive and custom organizational data attributes aren't available during Public Preview; support is planned for a later release.
Contextual files you upload: additional data or business context, when your administrator has enabled file uploads.
Available analysis depends on the data and permissions for your selected perspective. Data coverage and refresh timing vary by source; Interactive insights isn't a real-time monitoring service. You can ask which data and periods are available before beginning an investigation.
Availability
Interactive insights is automatically enabled for tenants in Frontier. For other tenants, a tenant administrator must enable it during Public Preview. You must have eligible access in the Global Partition. File uploads also depend on administrator configuration.
How to access and use Interactive insights
1. Open Interactive insights and choose your scope
Open Business Analytics.
If you have access to multiple partitions, at the top of the page, select the Global Partition.
On the left, select Interactive insights.
To begin a separate investigation, at the top left of the page, select New session ("+" icon). To continue an existing conversation, select it in the session history.
For a new session, select View as before submitting your first request. Depending on your access, you can choose your own view, delegated views, or other available data access roles.
The starting page includes a prompt box, suggested prompts, and session history.
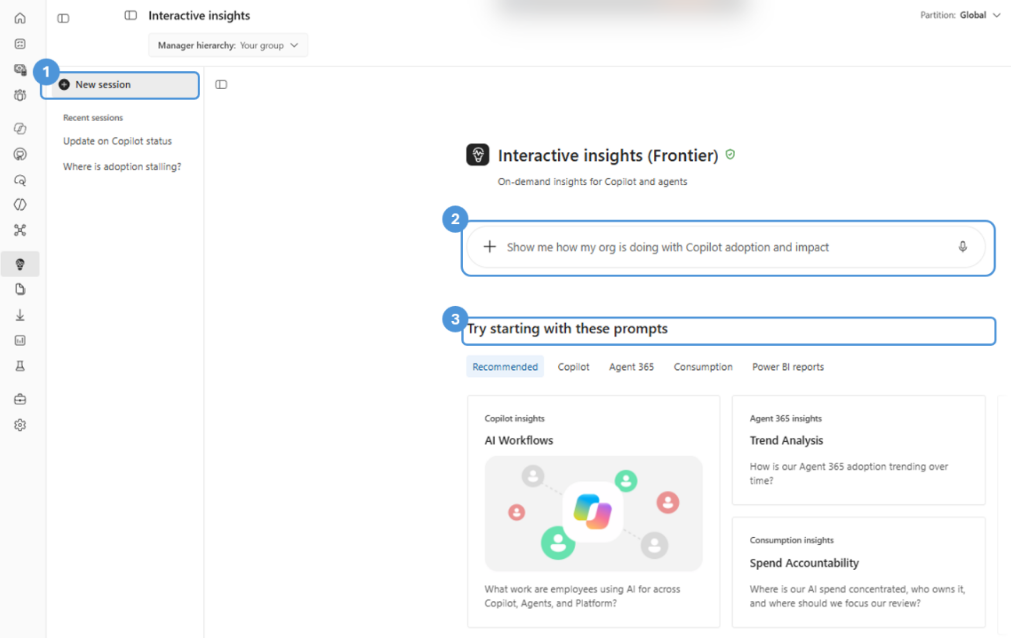
The session's data access scope is fixed when you submit its first request, including by selecting a suggested prompt. If you change the View as setting later, that doesn't update that session's scope. To use another authorized scope, select New session, choose the View as setting, and submit a new request.
Learn more about the app-wide explanation of views, roles, and available scopes.
2. Choose or write a request
Browse the suggested prompt categories and select a card to submit its question immediately, or write your own request in the prompt box.
Instruct Interactive insights as you would an analyst. Provide the business context, question, analytical preferences, assumptions, and intended output that matter to you. You don't need to fill out a template or know query syntax.
For example, you can write a prompt like this:
"We're preparing our next adoption review. Compare Copilot usage across my teams over the last two complete months, identify sustained bright spots, and give me a short brief with charts for the adoption leads."
If you have a preference or constraint, say so:
"Assume our company's fully burdened cost of labor is $50 per hour, and note that we started an engagement pilot on September 15."
When you leave details unspecified, Interactive insights uses its expertise and available context to choose an approach. It might ask a clarifying question when a missing detail materially affects the work.
3. Submit your request and check its progress
For a request you wrote, select Send (the arrow at the right of the prompt box) to begin. If you selected a suggested prompt, the request has already been submitted. Interactive insights then carries out the work and returns its response in the conversation.
Interactive insights uses domain knowledge and skills to plan the work, data tools to retrieve authorized information, and code and other tools to calculate results and create outputs. It checks the work and adjusts its approach in a loop as needed. Not every request needs every capability; a detailed investigation or report can take longer than a simple question.
The Reasoning component is an optional view of work summaries and tool activity associated with a response. You don't need to follow it while Interactive insights works. Use it to check progress or audit how a request was carried out.
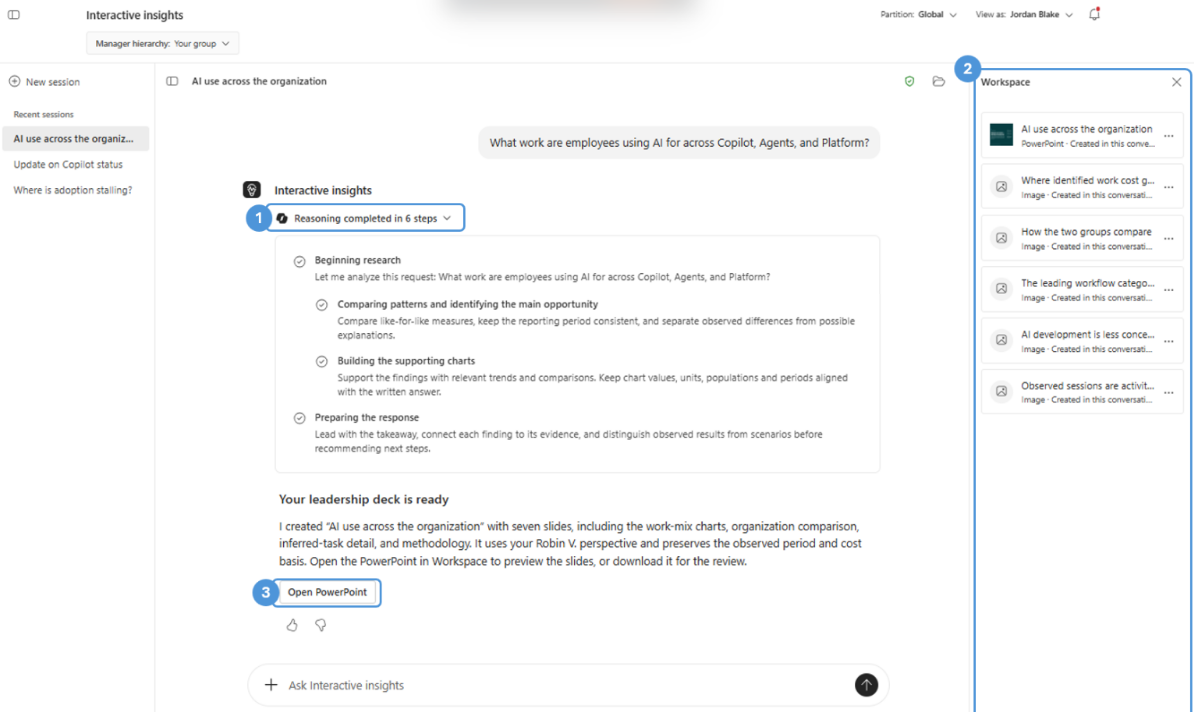
Select the Reasoning component to expand or collapse it. After a response completes, it can show a summary such as "Reasoning completed in ... steps." Open individual entries where details are available to:
Look for references to the data or attached files you intended it to use.
Check whether its stated scope and time period match your request.
Open available step details to inspect tool activity, including code where shown, or reported errors and retries.
To audit an approach, ask: "Summarize the data sources, methods, and assumptions you used for this comparison."
The component shows execution information available in the experience, not a complete record of internal model reasoning or a guarantee that the answer is correct.
4. View artifacts as they appear in Workspace
Inline answers appear in the conversation. Workspace collects generated charts, web reports, and data files as Interactive insights produces them. PowerPoint presentations are available through the download link in the response.
To work with an artifact:
Select the Workspace control to open the panel.
Select an artifact to open its preview.
Select Download to save a copy.
Close the preview to return to the conversation. Collapse Workspace when you want more room for chat.
Preview options depend on the file type. File links can also appear directly in the response.
5. View your outputs and refine them
Review the delivered response or artifact, then continue in the conversation to refine it. You can add business context, steer the analysis and assumptions, or change the audience, depth, and formatting.
| To refine | Try asking |
|---|---|
| Business context and analytical focus | "We started an engagement pilot on September 15. Compare the usage trend before and after that date, and focus on sustained changes rather than one-week spikes." |
| Methods and assumptions | "Compare the groups over the same period and show activity per active user alongside total activity." |
| Audience, depth, and formatting | "Give adoption leads a detailed team comparison. Put the rollout decisions in a one-page executive summary, followed by supporting charts and definitions." |
You can also request a different output format in your first question or later in the conversation:
| To create | Try asking |
|---|---|
| An inline answer with charts | "Give me a concise briefing here for tomorrow's adoption-lead sync. Focus on the three strongest AI usage bright spots, with charts and questions for the team." |
| A web report | "Create a web report for our regional adoption leads to explore AI usage bright spots. Use a one-page executive summary followed by detailed team comparisons, with navigation between sections." |
| A PowerPoint presentation | "Create a PowerPoint presentation for a 30-minute steering committee review focused on AI usage bright spots. Emphasize what leaders should discuss and decide." |
Open the artifact delivered in the new response to review a revision.
A generated web report is a file produced for your request. Creating one doesn't publish it to the app's Reports page, establish a live Power BI connection, or schedule future refreshes.
Optional: Add your own data
If your administrator has enabled file uploads, you can attach files to supply additional data or business context. This is optional; you don't need to upload a file to analyze the available organizational metrics.
In the prompt box, select Attach files (the "+" button on the left).
Choose the file you want to use.
Ask a question that references its content, then select the Send button.
For example, attach a spreadsheet with rollout groups and dates, then ask:
"Compare Copilot usage before and after the rollout dates for the groups in my file. Prepare charts and a short summary for our rollout review."
You don't need to describe the file's structure. You can add text and data files, such as .csv or Excel spreadsheets, text or Markdown files, and Word documents.
An attachment supplies input for the session; it doesn't grant additional access to organizational data or permanently add a source to Business Analytics.
Troubleshooting
| If you encounter this | Try this |
|---|---|
| Interactive insights is missing or access is denied | If you have access to multiple partitions, select the Global Partition. If the issue continues, ask your administrator to verify enablement and your access. |
| You need to use a different data access scope | Select New session, choose the authorized View as setting, and submit a new request. |
| File attachment isn't available | Ask your administrator whether uploads are enabled for your organization. |
| Interactive insights can't answer part of your question | Ask which data is available for the requested group and period, or narrow the request. |
| An analysis fails | Check the reported issue in the conversation or the Reasoning component, then ask Interactive insights to retry the failed part or simplify the request. |
| You can't find a generated file | Use the file link in the response that delivered it. For charts, web reports, and data files, you can also open Workspace. |
| You reach a fair use limitation | Follow the guidance shown in the experience. You can also continue analysis in Copilot Chat or Cowork, subject to the data and capabilities available there. |
Use the response's feedback controls to report a problem with an answer, or contact your administrator for access and configuration issues. Don't include unnecessary sensitive information in a feedback submission.