Note
Access to this page requires authorization. You can try signing in or changing directories.
Access to this page requires authorization. You can try changing directories.
Important
This feature is part of the Frontier preview program. Frontier connects you directly with Microsoft's latest AI innovations. Frontier previews are subject to the existing preview terms of your customer agreements. As these features are still in development, their availability and capabilities might change over time.
The Microsoft Copilot page in Business Analytics gives leaders, analysts, and other stakeholders one place to understand how Microsoft Copilot is being used across their organization and the value it provides.
Use the page to review adoption, usage, impact, and employee sentiment for Microsoft Copilot. You can also explore insights for related Copilot services from the tabs available on the page.

Note
The insights and features available to you can vary based on your organization's licenses, data availability, and access permissions.
Why use the Microsoft Copilot page
The Microsoft Copilot page brings together insights that can help your organization maximize its investment in Copilot. Use the page to:
Get a starting point for understanding Copilot adoption and impact across your organization
Understand how broadly and consistently people are adopting Copilot
Identify which organizational groups and Microsoft 365 apps are driving usage
Explore how people are using Copilot features to complete their work
Estimate the time and value associated with Copilot-assisted activities
Review employee feedback and sentiment about Copilot
Identify groups that might benefit from additional enablement, training, or adoption support
Access insights for other Copilot services available to your organization
Consider reviewing the page regularly to track progress and identify changes that need attention.
How to filter the data
Use the filters at the top of the page to focus the data on the time period and employee population you want to analyze. The filters you select apply to the insights shown on the page.
The following filters are available:
Time Period: Choose the period for the analysis, which defaults to the last 28 days. You can select the latest four-week period, month to date, quarter to date, year to date, all available time, or a custom range.
Manager hierarchy: Select the part of the management hierarchy you want to analyze. You can switch between Your company and Your group, and search for or select managers within the hierarchy.
Organization: Filter the results by organization. You can select one or more organizations or search by name.
License: Filter the results by license. For Copilot in Microsoft 365, you can select Microsoft 365 Copilot, Copilot Chat, or All.
Job function: Filter the results by one or more job functions, such as Engineering, Sales, Marketing, or Finance. The available job functions are based on your organization's data.
User segment: Filter employees by user segment. Available segments include Power users, Habitual users, and Novice users.
Usage level: Filter employees based on their usage level. Available options include Top 1%, Top 5%, Top 25%, and Top 50%.
To change which filters appear at the top of the page, on the right, select Customize filters. Time Period and Manager hierarchy are required. You can add or remove other available filters. For example, Country/region and Location can be added when those attributes are available.
You can also use Partition to change the population being analyzed when multiple partitions are available to you.
Check the population and data freshness
After you apply filters, check Filtered headcount in the upper-right corner of the page. Filtered headcount shows the number of employees included based on your current filter selections. Use this information to understand the population represented by the insights on the page.
Also check Data available to understand how current the displayed data is. The date represents the latest complete dataset available for the current view. Because the Microsoft Copilot page combines data from multiple sources, individual datasets can have different dates:
Usage-based cost & sessions identifies usage-based cost and credits for Microsoft 365 services, GitHub Copilot usage-based cost, usage-based sessions and users, billing policy and budget details, and model insights. Data typically is available after two days of activity.
Microsoft & GitHub Copilot, agents, use cases and value identifies Microsoft 365 Copilot and Copilot Chat usage, GitHub Copilot usage, agent usage (including Agent 365), Cowork usage, use case insights, assisted hours, AI value and satisfaction scores. Data typically is available after three days of activity.
As a result, the Data available date might be earlier than the end of the selected time period. Check the data-through information when interpreting recent results, particularly when you're comparing metrics that come from different data sources.
Explore the Microsoft Copilot tabs
The Microsoft Copilot page is organized into tabs for the Copilot services available to your organization. The tabs you see can depend on product availability, licensing, and your permissions.
Copilot in M365
Use the Copilot in M365 tab to understand how people in your organization use Microsoft 365 Copilot and the impact it might have on their work.
The tab brings together four categories of insights:
Readiness: Assess your organization's progress toward activating Copilot and review relevant recommendations for expanding access and adoption
Adoption: Track active users, usage trends, returning users, usage levels, and adoption across Microsoft 365 apps and organizational groups
Impact: Review Copilot actions, estimated assisted hours and value, and other indicators of how Copilot supports people's work
Sentiment: Understand how employees perceive Copilot by reviewing feedback and available survey results
Use filters and organizational attributes to focus the analysis on the groups relevant to you. Depending on your access, you might be able to view information for the entire organization, your own group, or selected organizational groups.
Understand Copilot adoption
Select Adoption to understand how broadly Microsoft 365 Copilot is available and being used across the population you've selected. The summary cards provide a quick view of licensing, active use, returning use, and usage levels:
Copilot licensed employees shows the number of employees with a Copilot license.
Active Microsoft 365 Copilot users shows the number of Microsoft 365 Copilot users who were active during the selected period.
Returning users shows the number of Microsoft 365 Copilot users who returned to use Copilot.
Usage levels shows the number of users in a selected usage level, such as power users.
Use these metrics together to understand the progression from Copilot availability to active and recurring use. You can then explore the detailed insights on the page to better understand how Copilot is being used. When benchmarks are available, you can use them to add context to your organization's adoption results.
Evaluate Copilot impact
Select Impact to explore Copilot activity and estimate the time and value associated with Copilot-assisted work.
Two summary metrics provide a high-level view of impact:
Copilot actions shows the number of actions completed with Copilot across Microsoft 365.
Assisted hours estimates the number of hours of work assisted by Copilot.
You can change the assisted-hours card to display AI value, which estimates the monetary value associated with Copilot-assisted hours.
To understand how assisted hours and value are estimated, open the Copilot hours and value calculator. The calculator shows the Copilot capabilities included in the calculation and their associated assisted hours. Use the calculator to:
Review how individual Copilot capabilities contribute to assisted hours and value.
Switch between the hours and value calculations.
Select a currency.
Adjust the average hourly rate used to estimate value.
AI value is calculated by applying the average hourly rate to the estimated assisted hours for the included Copilot capabilities. Changes you make to the currency or hourly rate update the AI value shown on the Impact page for the current session. Saved settings aren't changed.
Use these estimates as indicators of where Copilot might be contributing time and value, and explore the detailed Impact insights to understand the activities contributing to those estimates.
Understand employee sentiment
Select Sentiment to understand how employees respond to their experiences with Copilot.
The summary cards provide two measures:
Satisfaction rate shows the percentage of positive reactions to Copilot based on user reactions. The card also shows the number of positive reactions and total reactions used to calculate the rate and the change in satisfaction rate.
High satisfaction among habitual and power users shows the percentage of habitual and power users with high satisfaction. The card also shows the change in this percentage.
The sentiment metrics use data from the last 90 days, as indicated on the cards. Use the metrics together to understand overall satisfaction and how satisfaction among more frequent Copilot users compares with the broader population.
Explore the trend information on the page to see how sentiment changes over time and to compare results across available organizational attributes.
Other Copilot tabs
Additional tabs can provide insights for other Microsoft Copilot services available to your organization. Use these tabs to examine service-specific usage, cost, and value.
Available tabs might include experiences for services such as Copilot Cowork, Code, or Autopilot. The available services and the information shown can change as services become available to your organization.
Understand Copilot Cowork usage and value
Select Cowork to understand how people in your organization use Copilot Cowork, what they use it for, the cost associated with that usage, and the estimated value of Cowork-assisted work.
The summary cards provide a high-level view of Cowork usage, task completion, cost, satisfaction, and estimated value:
Active users shows the number of active Cowork users. The card also shows active users as a percentage of enabled users and the change in active users.
Average sessions per user shows the average number of Cowork tasks, or conversations, initiated per user. This includes multiple instances of a scheduled task.
Cost shows the Cowork usage-based cost for the selected time period and filters. The card also indicates whether a Cowork budget has been set.
Satisfaction rate shows the percentage of Cowork reactions that are likes, along with the number of likes and total reactions.
Note
Use case insights might be available for only a subset of Cowork sessions matching your selected time period and filters. Check the coverage information at the top of the page before interpreting use case insights. Each session counts once toward coverage, even when the session contributes to multiple use cases.
Understand what Cowork is used for
Use What Cowork is used for to explore the work people do with Copilot Cowork, from broad domains down to specific use cases. This section helps you understand where Cowork activity, cost, and value come from.
Note
Use case data is only available for the date range shown at the top of the section. The Time period filter at the top of the page doesn't apply to this section. Use case data is available starting November 8, 2026, so it doesn't include sessions before that date.
The three cards at the top of the section summarize the Cowork sessions that have an identified use case:
Sessions with identified use cases shows the number of distinct Cowork sessions with at least one identified use case. It also shows those sessions as a percentage of total Cowork sessions. Each session counts once, even if it maps to more than one use case.
Cost of identified use cases shows the cost attributable to identified use cases. Sessions without an identified use case aren't included. You can switch the card between dollars and Copilot Credit usage.
AI value of identified use cases estimates the value of the time a person would have needed to do the work Cowork completed. You can switch the card to show Assisted hours. To see how the estimate is calculated, open the calculator on the card.
Because these cards only cover sessions with an identified use case, their totals can be lower than the Cowork totals in the summary cards at the top of the tab.
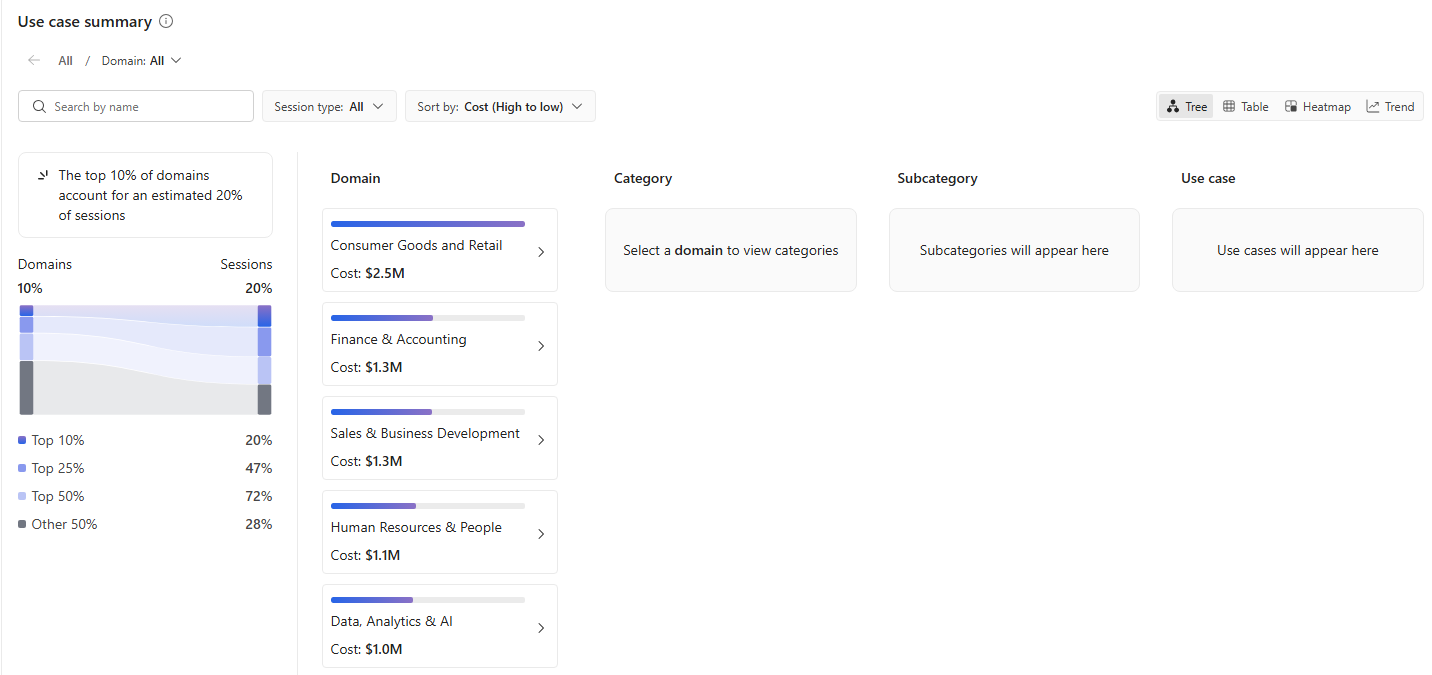
You can then explore Cowork usage through a hierarchy of:
- Domain
- Category
- Subcategory
- Use case
Select a domain to drill into its categories, then continue through subcategories and individual use cases. Use the available controls to search the hierarchy, select a session type, and change the measure used to analyze the results. Available measures can include cost, sessions, active users, assisted hours, and AI value.
You can view the results as a Tree, Table, Heatmap, or Trend to examine the same usage information from different perspectives.
The page also highlights how Cowork sessions are distributed across domains. Use this information to understand whether Cowork usage is concentrated in a small number of work areas or distributed more broadly across the organization.
Understand model usage and cost
Use Model insights to understand which AI providers and models contribute to Cowork usage and cost.
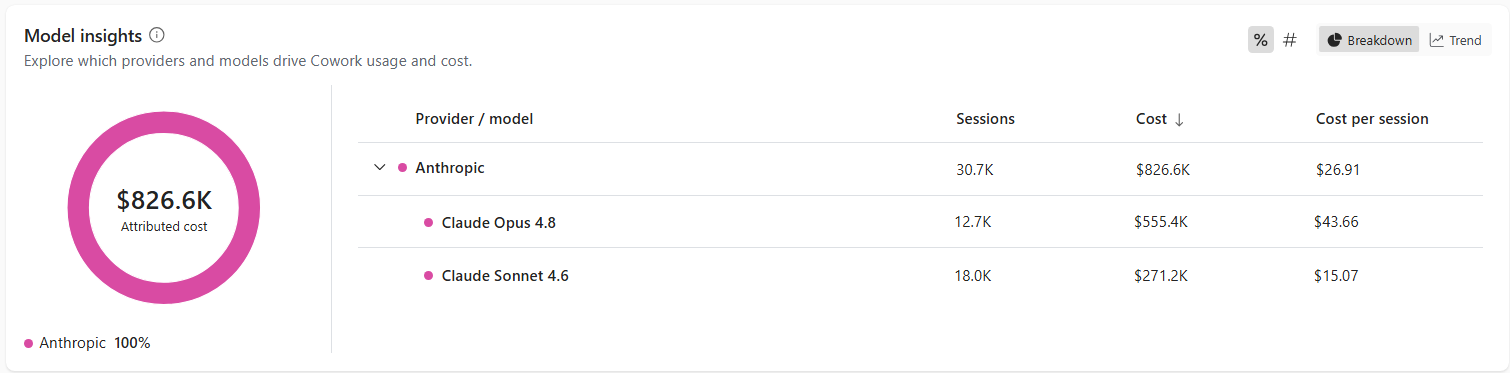
The section shows attributed cost together with provider- and model-level information, including:
- Sessions
- Cost
- Cost per session
Expand a provider to see the individual models associated with it. Use Breakdown to compare providers or models for the selected period, or Trend to examine changes over time.
These insights can help you understand how Cowork costs are distributed across the models supporting Cowork activity.
Compare users and groups
Use User and group comparisons to compare Cowork activity across different parts of your organization.
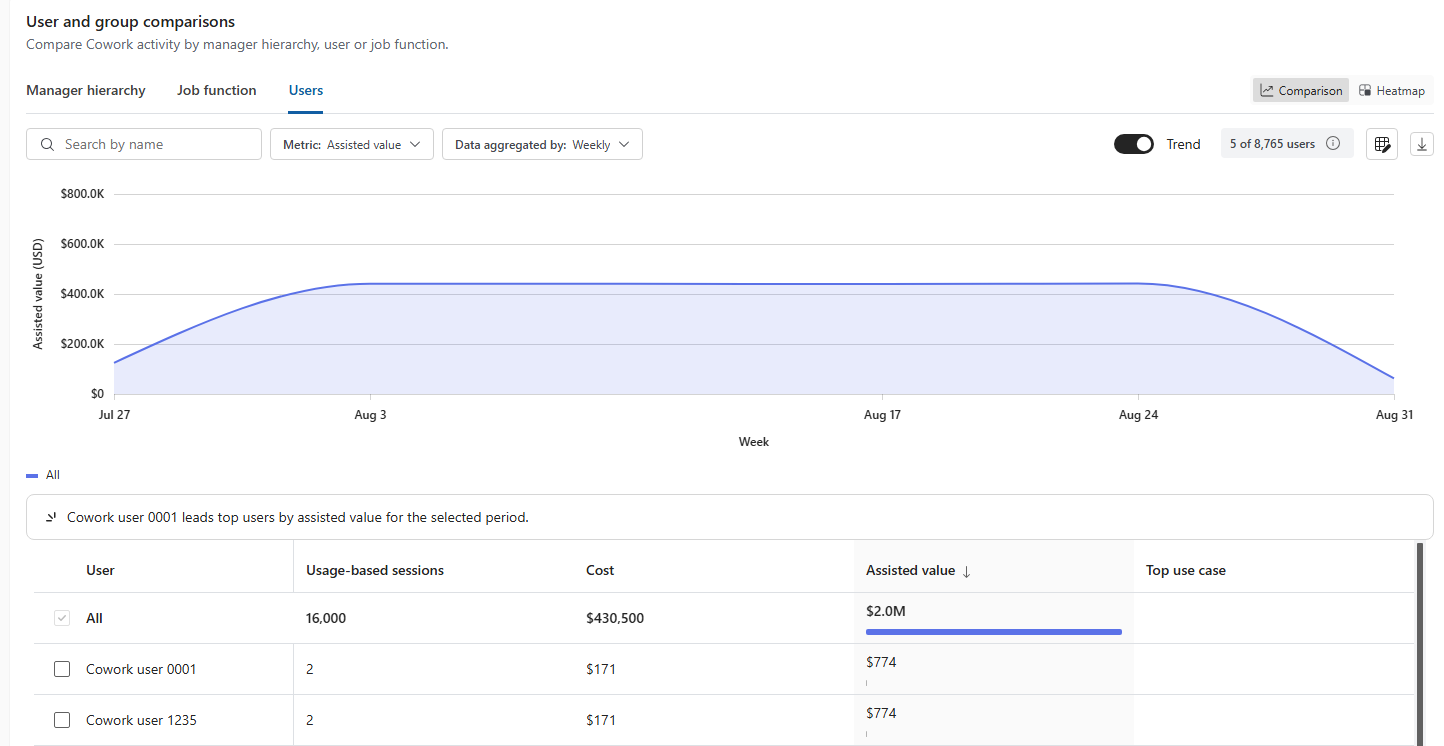
You can compare results by:
- Manager hierarchy
- Job function
- Users
Select a metric and aggregation period to determine what you want to compare. For manager-hierarchy comparisons, you can also select the hierarchy level.
The comparison includes measures such as active users, usage-based sessions, cost, average cost per user, and AI value. On the right, use Comparison to compare groups directly, Heatmap to explore differences visually, or Trend to examine changes over time.
Use these insights to identify differences in Cowork usage, cost, and estimated value across organizational groups.
Understand the deliverables produced
Use Deliverables produced to understand the outputs and actions that result from completed Cowork sessions.
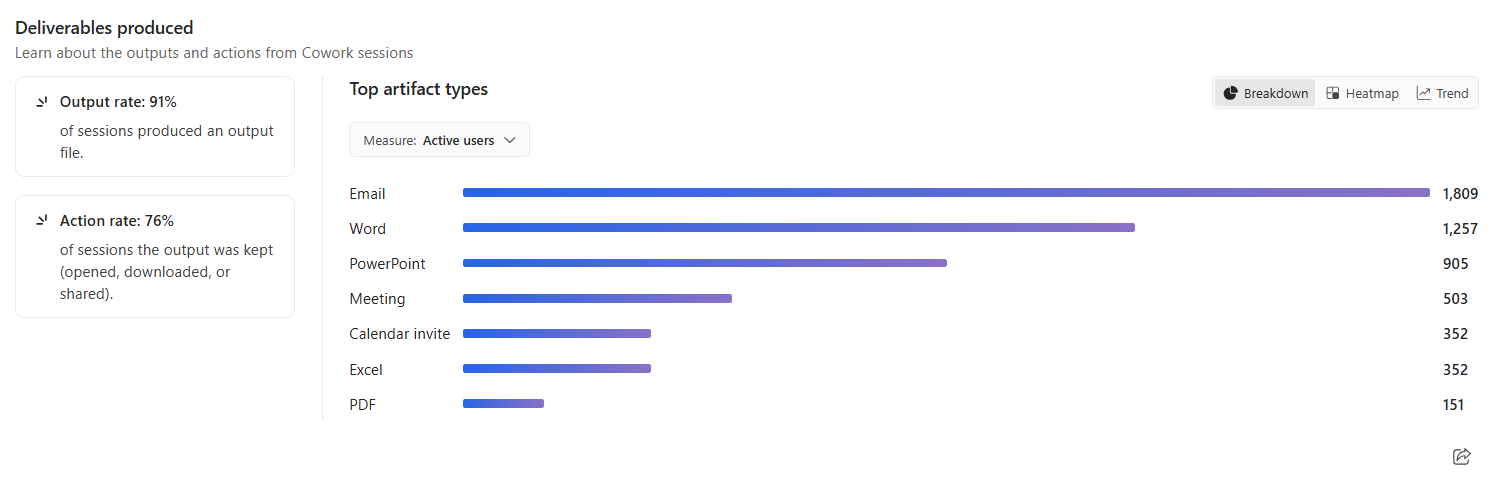
The section includes:
Output rate, which shows the percentage of tasks that produced an output file
Top artifact types, which shows the types of outputs produced from Cowork sessions
Use the metric selector to analyze artifact types based on the available measures. On the right, you can also switch between Breakdown, Heatmap, and Trend views.
Use these insights to move beyond task completion and understand what Cowork produces and whether people take action on the resulting outputs.
Explore automation and skills
Use this section to understand the proportion of Cowork sessions that are user-initiated compared with scheduled sessions, and identify skills used during Cowork sessions.
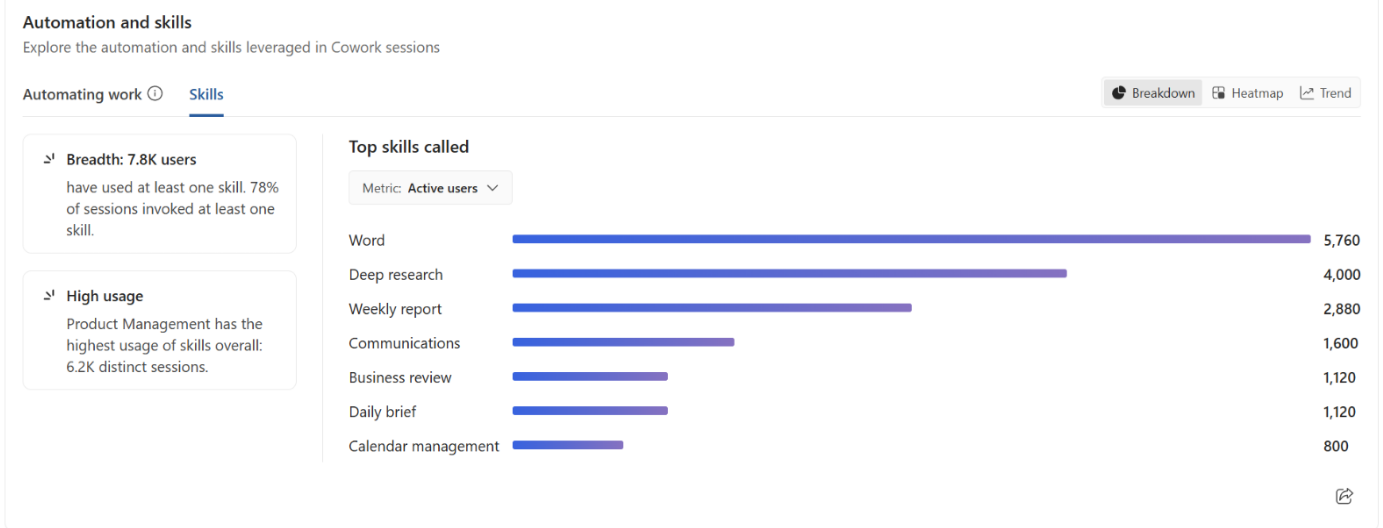
Change the metric to explore plug-in usage from different perspectives. On the right, you can also switch between Breakdown and Heatmap views.
Select Skills to explore skill usage in Cowork sessions.
Use these insights to understand which connected services and capabilities contribute to Cowork activity across your organization.
Understand Code usage, cost, and satisfaction
Select Code to understand Code activity, consumption, cost, and satisfaction across your organization. Use the summary metrics to get a high-level view of Code usage for the selected period, then use group comparisons to understand how activity and outcomes vary across groups and users.
The summary cards provide the following information:
Active users shows the number of distinct people who were active during the selected period and with the selected filters. Each person is counted once.
Sessions shows the number of Code activity sessions. Sessions are an activity measure, not a billable-session measure, so don't use the session count to infer Copilot credits or cost.
Copilot credits shows Copilot credit consumption for Code. You can switch the consumption card between Copilot credits and Cost.
Cost shows the monetary cost of Code credits and uses the Consumption reporting contract. Check the data-through date associated with the metric to understand how current the cost data is.
Satisfaction rate shows the percentage of reactions that are likes. The card also shows the number of likes and total reactions used to calculate the rate and the change in satisfaction rate.
Compare Code usage across groups
Use Group comparisons to explore Code activity, consumption, and outcomes for the selected period.
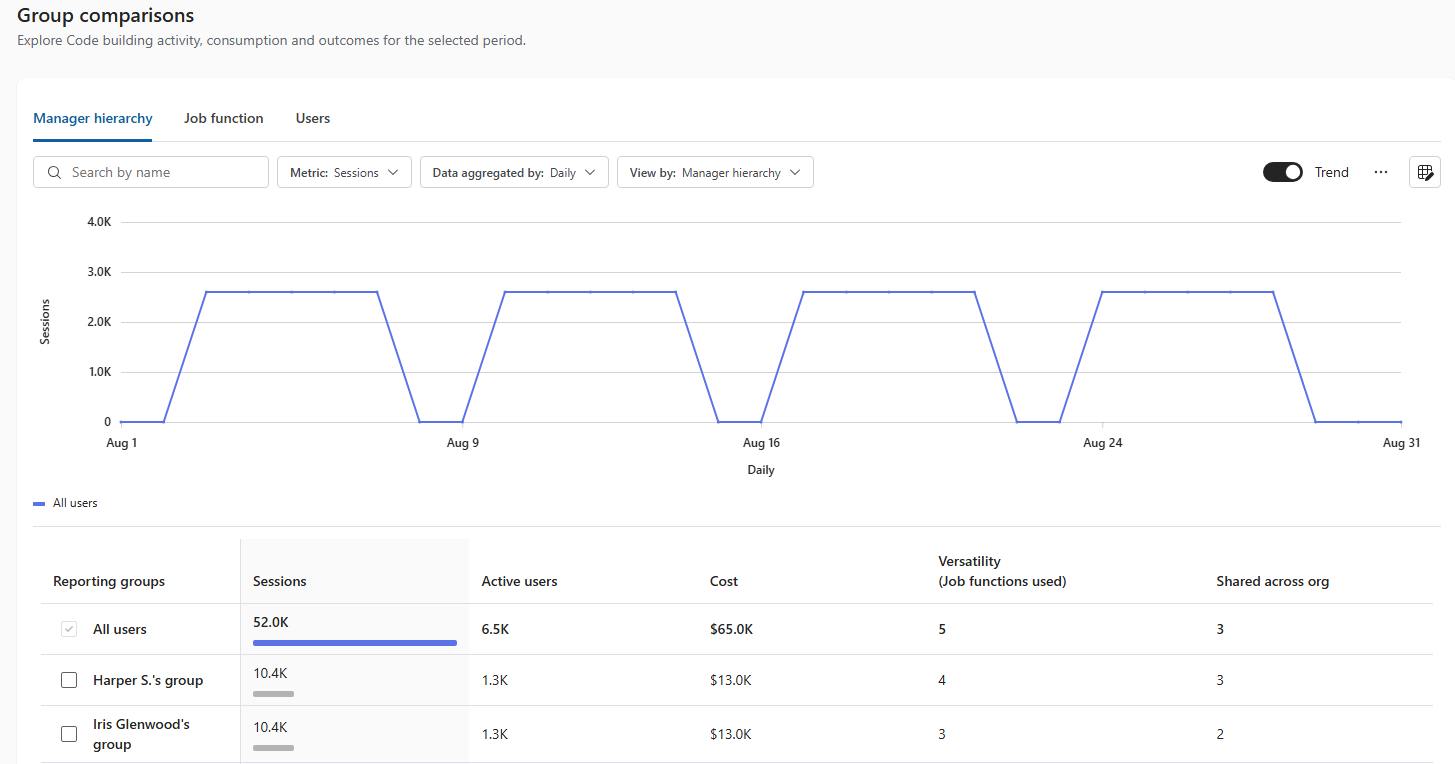
You can compare results by:
- Manager hierarchy
- Job function
- Users
Select a metric to determine what you want to compare, and select an aggregation period to control how the data is grouped over time. For manager hierarchy, you can also change how the organizational hierarchy is represented.
The comparison provides measures such as:
- Sessions
- Active users
- Cost
- Versatility (Job functions used)
- Shared across org
On the right, select Trend to examine how the selected metric changes during the selected period. Use the results below the chart to compare the measures across individual reporting groups.
Use these insights to identify differences in Code activity, consumption, and outcomes across organizational groups and users.
Understand Autopilot usage and value
Select Autopilot to understand how Autopilot is being used across your organization, the associated cost and estimated value, and how usage differs across Autopilot instances and organizational groups.
The summary cards provide a high-level view of Autopilot usage:
Active users shows the number of active users and active users as a percentage of enabled users.
Sessions shows the number of Autopilot sessions. An Autopilot session is initiated by a trigger, such as a schedule or another agent, and is distinct from an individual task.
Instances shows the number of Autopilots provisioned in your organization.
Cost shows the Autopilot usage-based cost for the selected period and filters. The card also shows the configured Autopilot budget when one has been set.
You can also switch the Cost card to view Total credits, which shows credits across Autopilot automations.
Compare users and groups
Use User and group comparisons to compare Autopilot activity across different parts of your organization.
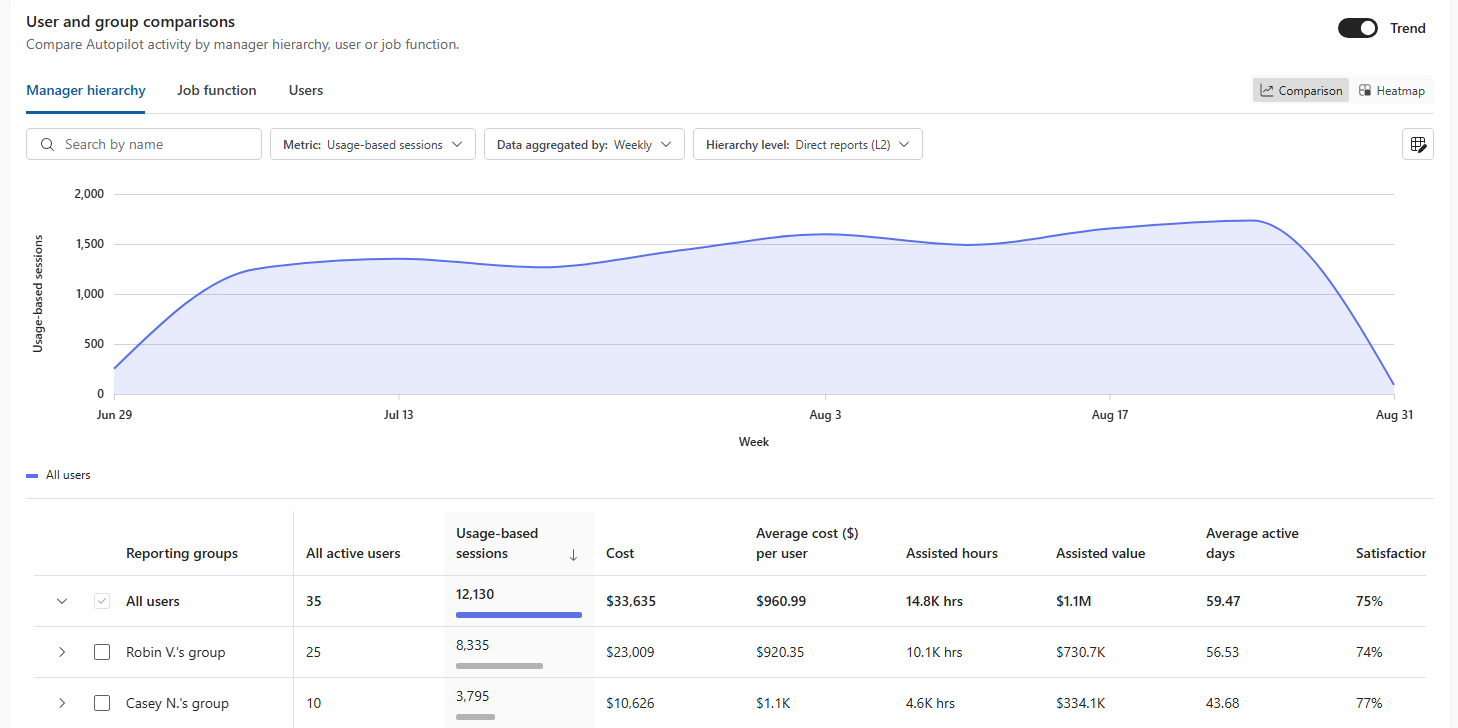
You can compare results by:
- Manager hierarchy
- Job function
- Users
Select a metric and aggregation period to define the comparison. For manager hierarchy, you can also select the hierarchy level.
Available comparison measures include:
- Active users
- Sessions
- Cost
- Active instances
On the right, select Comparison to compare groups directly, Heatmap to examine differences across groups and measures, or select Trend to see how the selected metric changes over time.
Compare Autopilot instances
Use Autopilot instances to compare individual Autopilot instances provisioned in your organization.
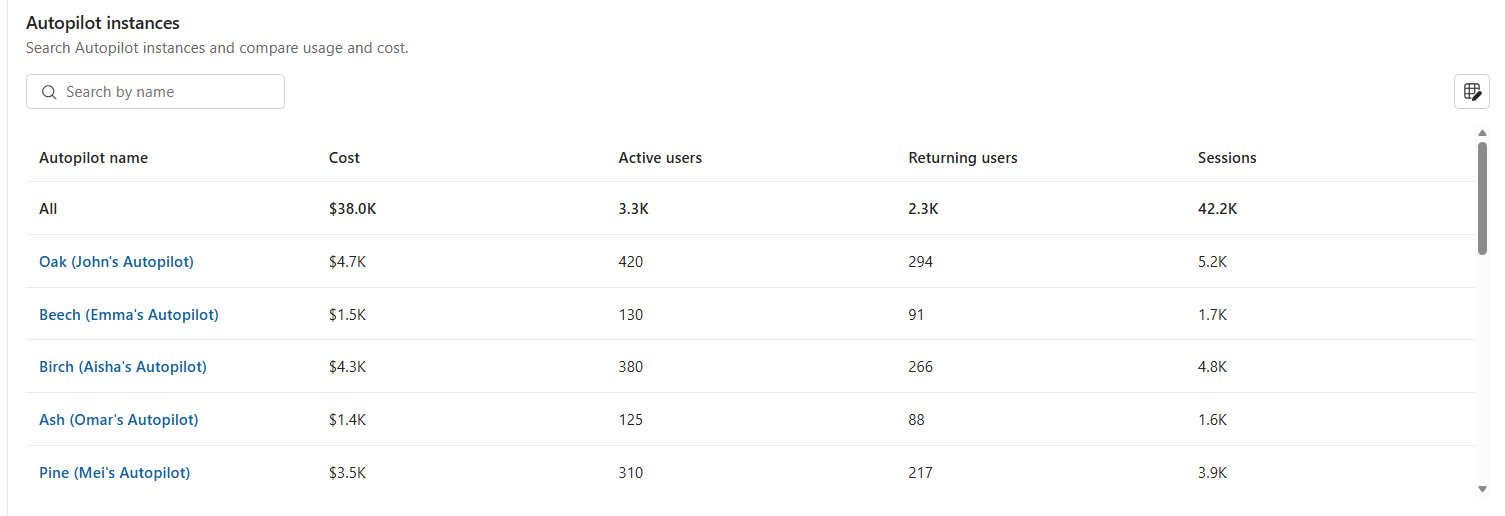
Search for an instance. For each instance, you can compare measures including:
- Active users
- Sessions
Use these insights to understand how usage and cost vary across Autopilot instances. You can also view a deep dive page for a specific Autopilot instance, with the same core usage and cost metrics.