Note
Access to this page requires authorization. You can try signing in or changing directories.
Access to this page requires authorization. You can try changing directories.
Applies to: Advanced Threat Analytics version 1.9
The entity profile provides you with a dashboard designed for full deep-dive investigation of users, computers, devices, and the resources they have access to and their history. The profile page takes advantage of the new ATA logical activity translator that can look at a group of activities occurring (aggregated up to a minute) and group them into a single logical activity to give you a better understanding of the actual activities of your users.
To access an entity profile page, select the name of the entity, such as a username, in the suspicious activity timeline.
The left menu provides you with all the Active Directory information available on the entity - email address, domain, first seen date. If the entity is sensitive, it tells you why. For example, is the user tagged as sensitive or the member of a sensitive group? If it's a sensitive user, you see the icon under the user's name.
View entity activities
To view all the activities performed by the user, or performed on an entity, select the Activities tab.
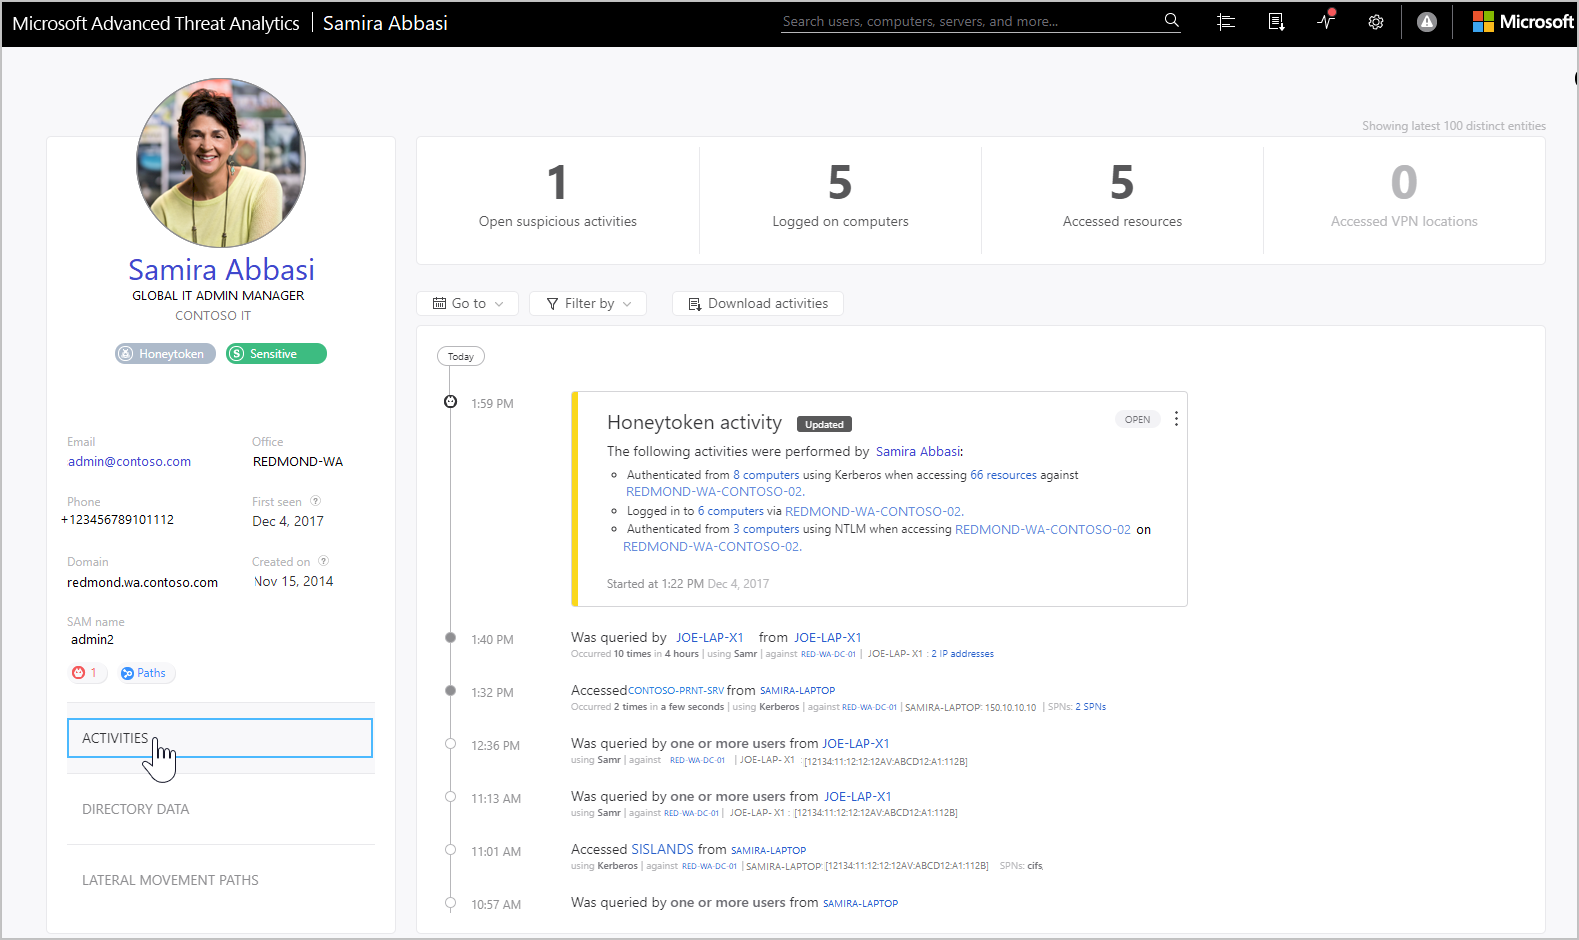
By default, the main pane of the entity profile displays a timeline of the entity's activities with a history of up to six months back, from which you can also drill down into the entities accessed by the user, or for entities, users who accessed the entity.
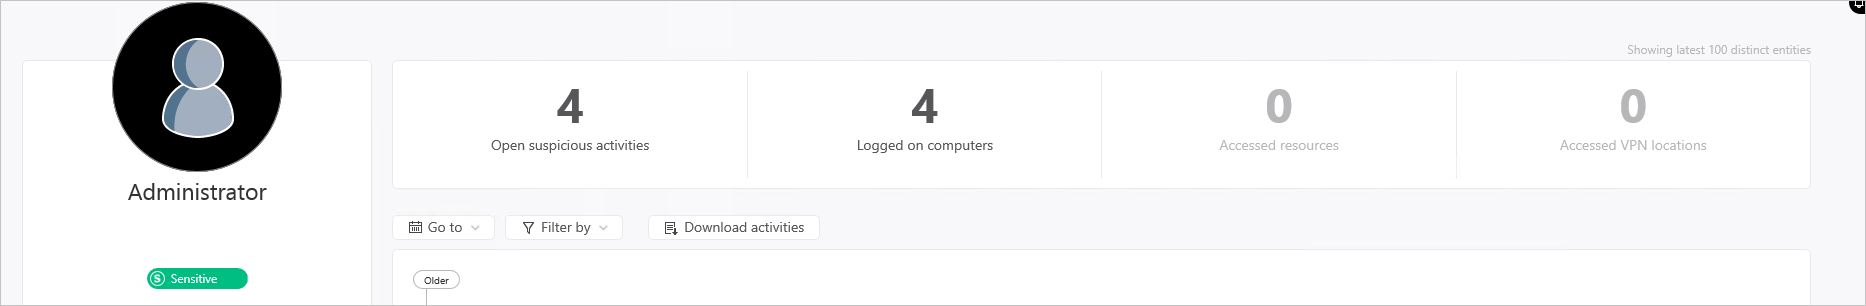
At the top, you can view the summary tiles that give you a quick overview of what you need to understand in a glance about your entity. These tiles change based on what type of entity it is, for a user, you see:
How many open suspicious activities there are for the user
How many computers the user logged on to
How many resources the user accessed
From which locations the user logged into VPN
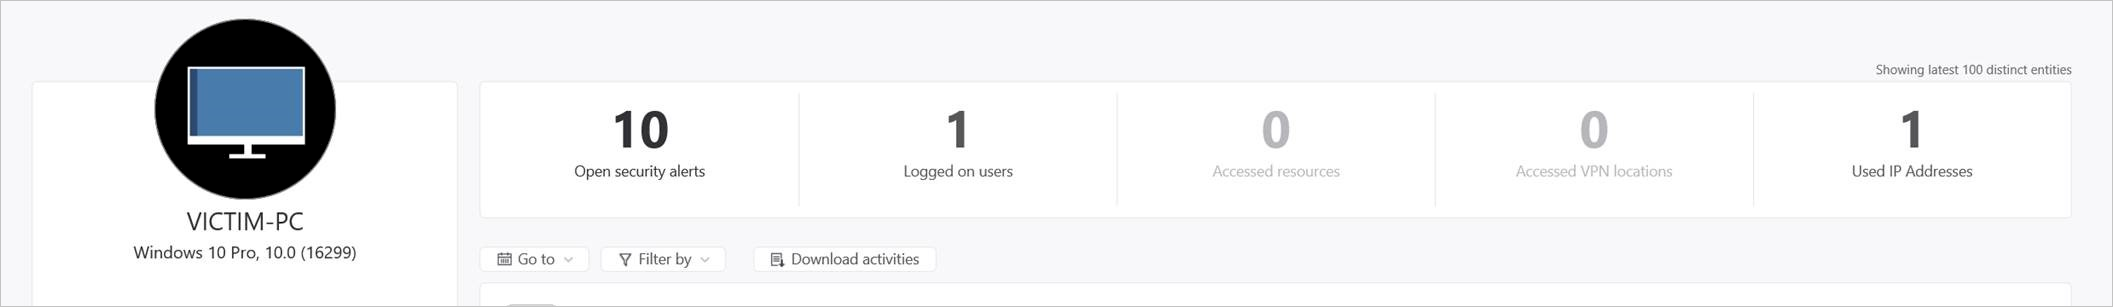
For computers you can see:
How many open suspicious activities there are for the machine
How many users logged into the machine
How many resources the computer accessed
How many locations VPN was accessed from on the computer
A list of which IP addresses the computer has used
Using the Filter by button above the activity timeline, you can filter the activities by activity type. You can also filter out a specific (noisy) type of activity. This is helpful for investigation when you want to understand the basics of what an entity is doing in the network. You can also go to a specific date, and you can export the activities as filtered to Excel. The exported file provides a page for directory services changes (things that changed in Active Directory for the account) and a separate page for activities.
View directory data
The Directory data tab provides the static information available from Active Directory, including user access control security flags. ATA also displays group memberships for the user so that you can tell if the user has a direct membership or a recursive membership. For groups, ATA lists up to 1,000 members of the group.
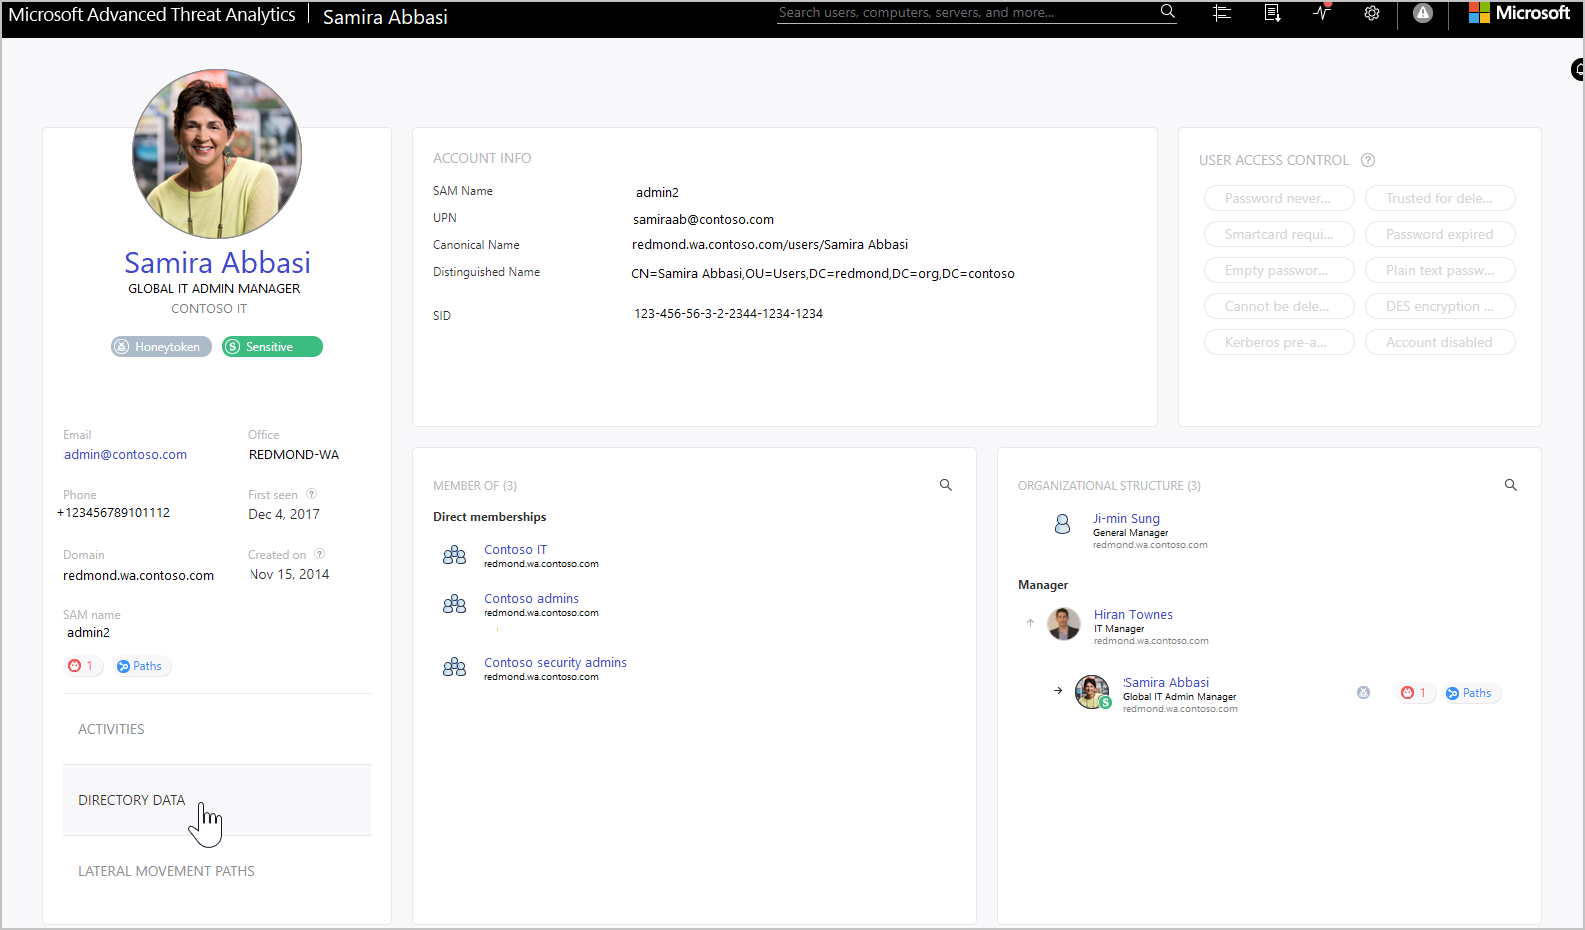
In the User access control section, ATA surfaces security settings that might need your attentions. You can see important flags about the user, such as can the user press enter to bypass the password, does the user have a password that never expires, etc.
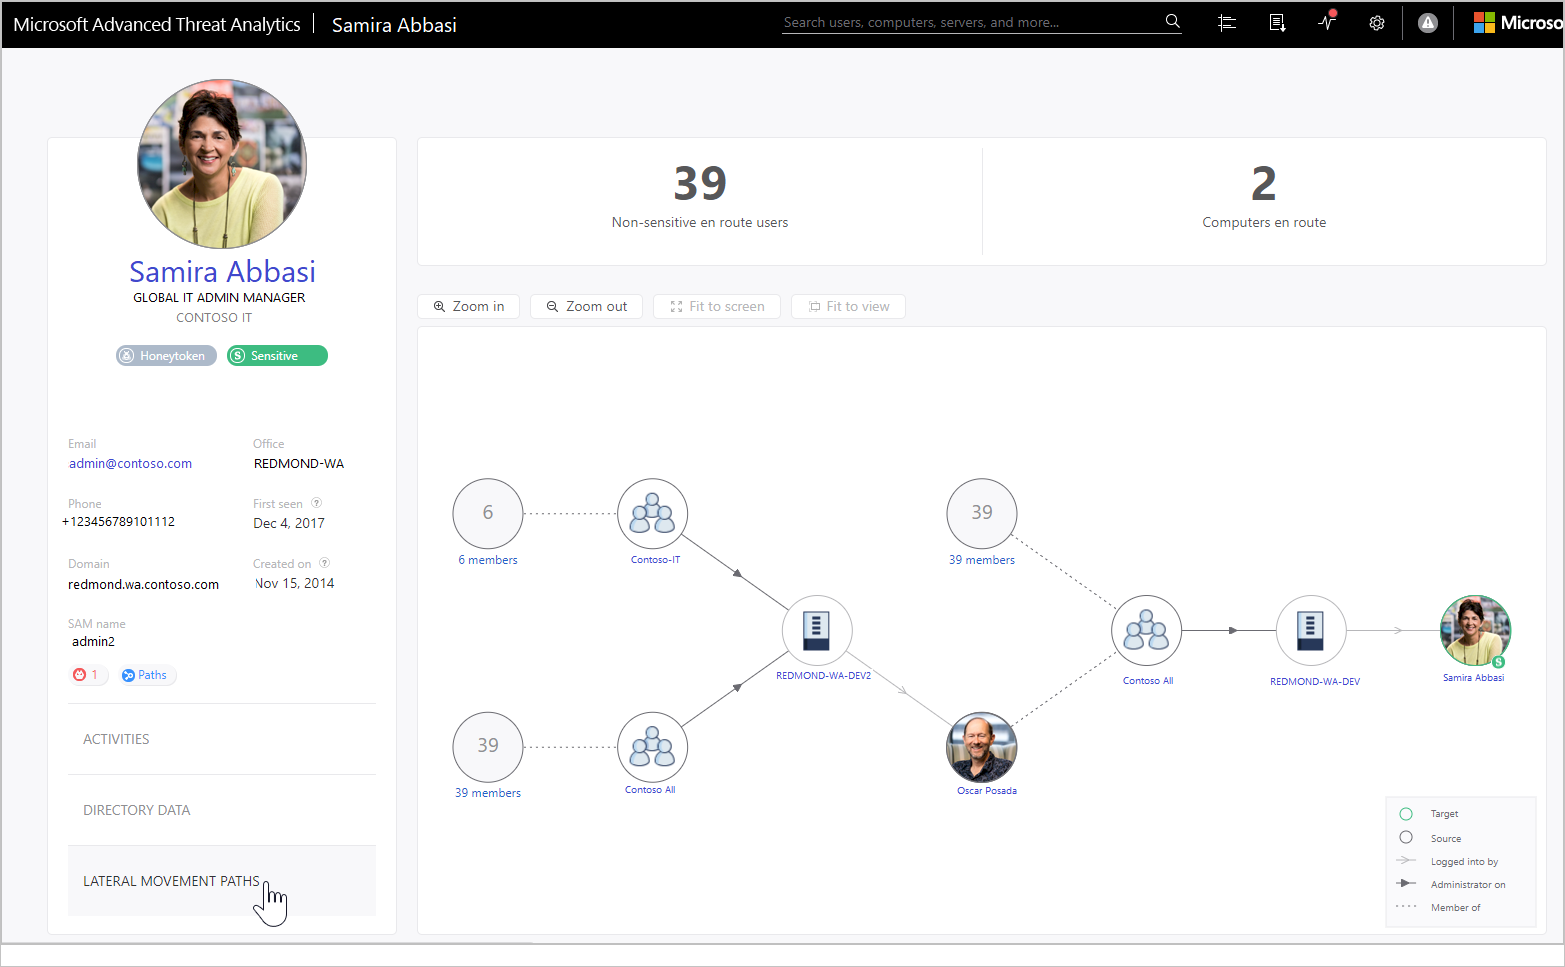
View lateral movement paths
By selecting the Lateral movement paths tab you can view a fully dynamic and clickable map that provides you with a visual representation of the lateral movement paths to and from this user that can be used to infiltrate your network.
The map provides you with a list of how many hops between computers or users an attacker would have to and from this user to compromise a sensitive account, and if the user themselves has a sensitive account, you can see how many resources and accounts are directly connected. For more information, see Lateral movement paths.