Note
Access to this page requires authorization. You can try signing in or changing directories.
Access to this page requires authorization. You can try changing directories.
Microsoft Advertising’s Report Builder gives you full control to create customized reports with your preferred breakdowns, filters, and metrics—no predefined templates required. Designed for both new and advanced advertisers, it helps uncover insights, compare campaign performance against KPIs, and optimize performance through tailored reports that can highlight trends, diagnose issues, and showcase results by campaign, device, region, or product. Here are a few examples of how advertisers are using the Report Builder:
- Weekly performance reports: Create detailed reports that break down spend and conversions by campaign and device to understand performance and optimize strategies.
- Investigate performance drops: Isolate key metrics across time periods and ad types to pinpoint causes of performance issues and take corrective actions.
- Client-facing reports: Generate reports showing campaign performance against KPIs like ROAS, CTR, and conversion rate, grouped by region and product line.
The benefits of using the Report Builder
Control and flexibility: Create reports that reflect your priorities by selecting specific breakdowns and metrics.
Efficiency: Focus on data that's relevant to you for more efficient analysis.
Improved interface: Build and edit reports easily with the streamlined user interface.
Build a report
From the navigation menu on the left, select Reporting > Home.
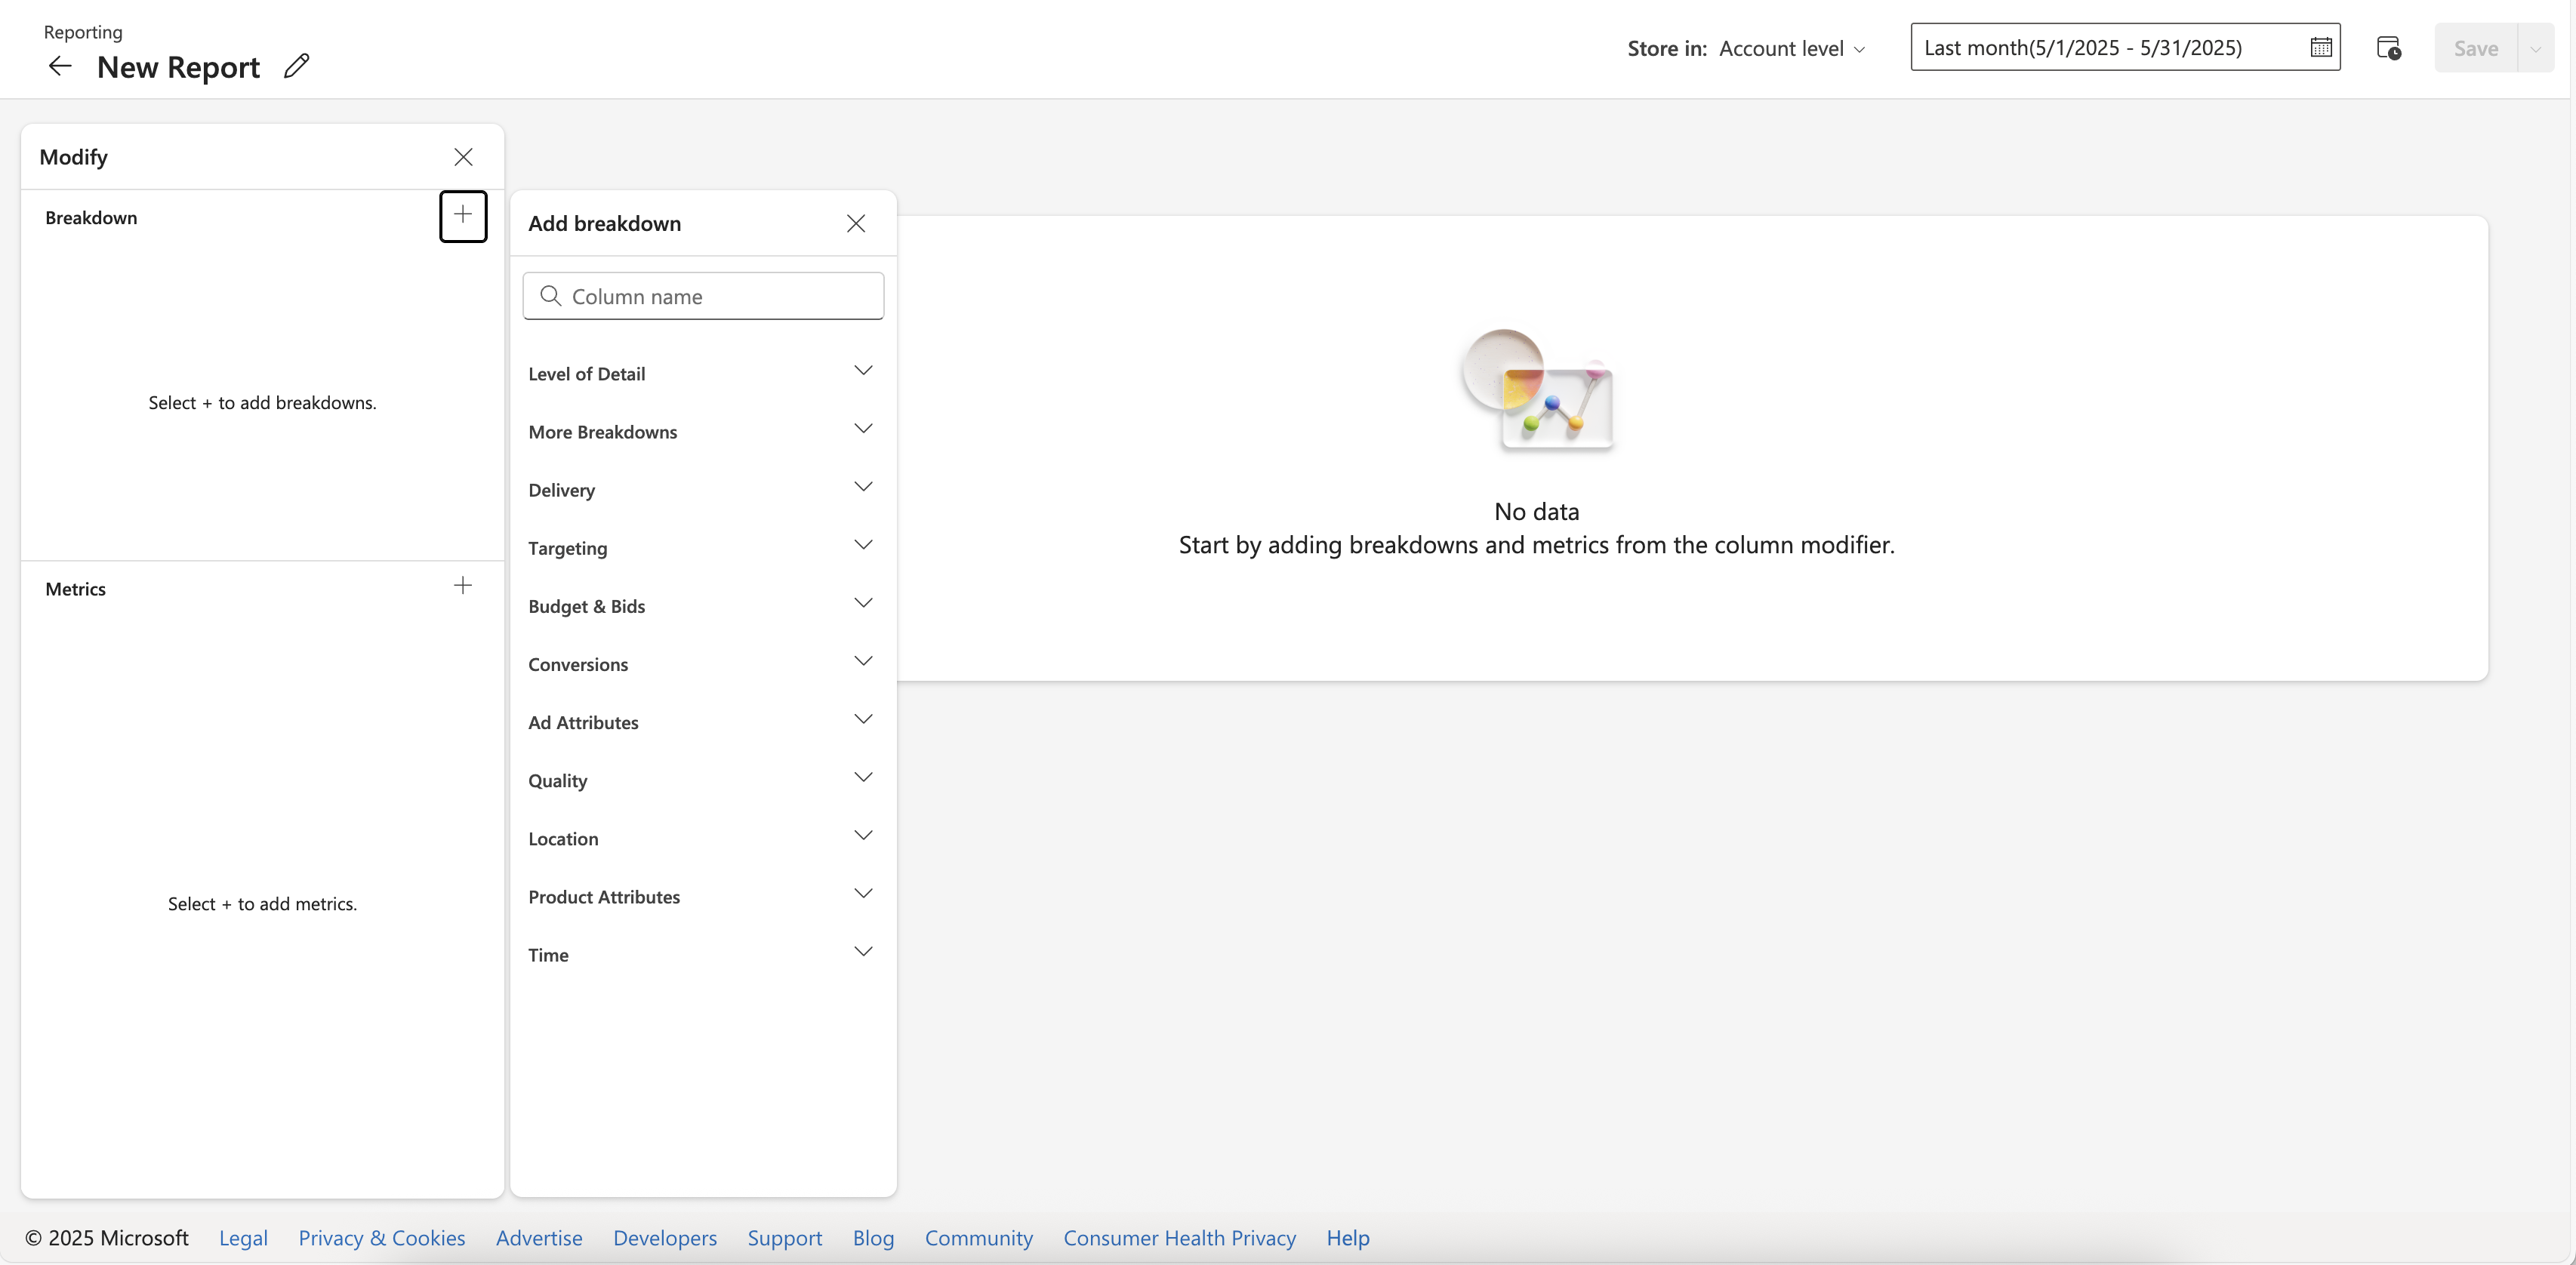
Select Create report.
In the left panel, next to Breakdown or Metrics,
Select + to add a breakdown or metric.
Select Expand > Remove next to a breakdown or metric to remove it.
Note
You can rearrange the order of your Breakdown or Metrics by dragging and dropping them as desired.
Specify the date range for your report using the date range selector, located in the top-right corner of the Report Builder.
Once you’re finished building your report, select Save.
Note
- Reports will not include campaigns, ad groups, keywords, or other entities with zero impressions.
- Reporting data is kept for limited periods of time. If you want to learn how far back hourly, daily, weekly, monthly, yearly and summary aggregated data can be retrieved for a report type, see this Bing Ads API doc.
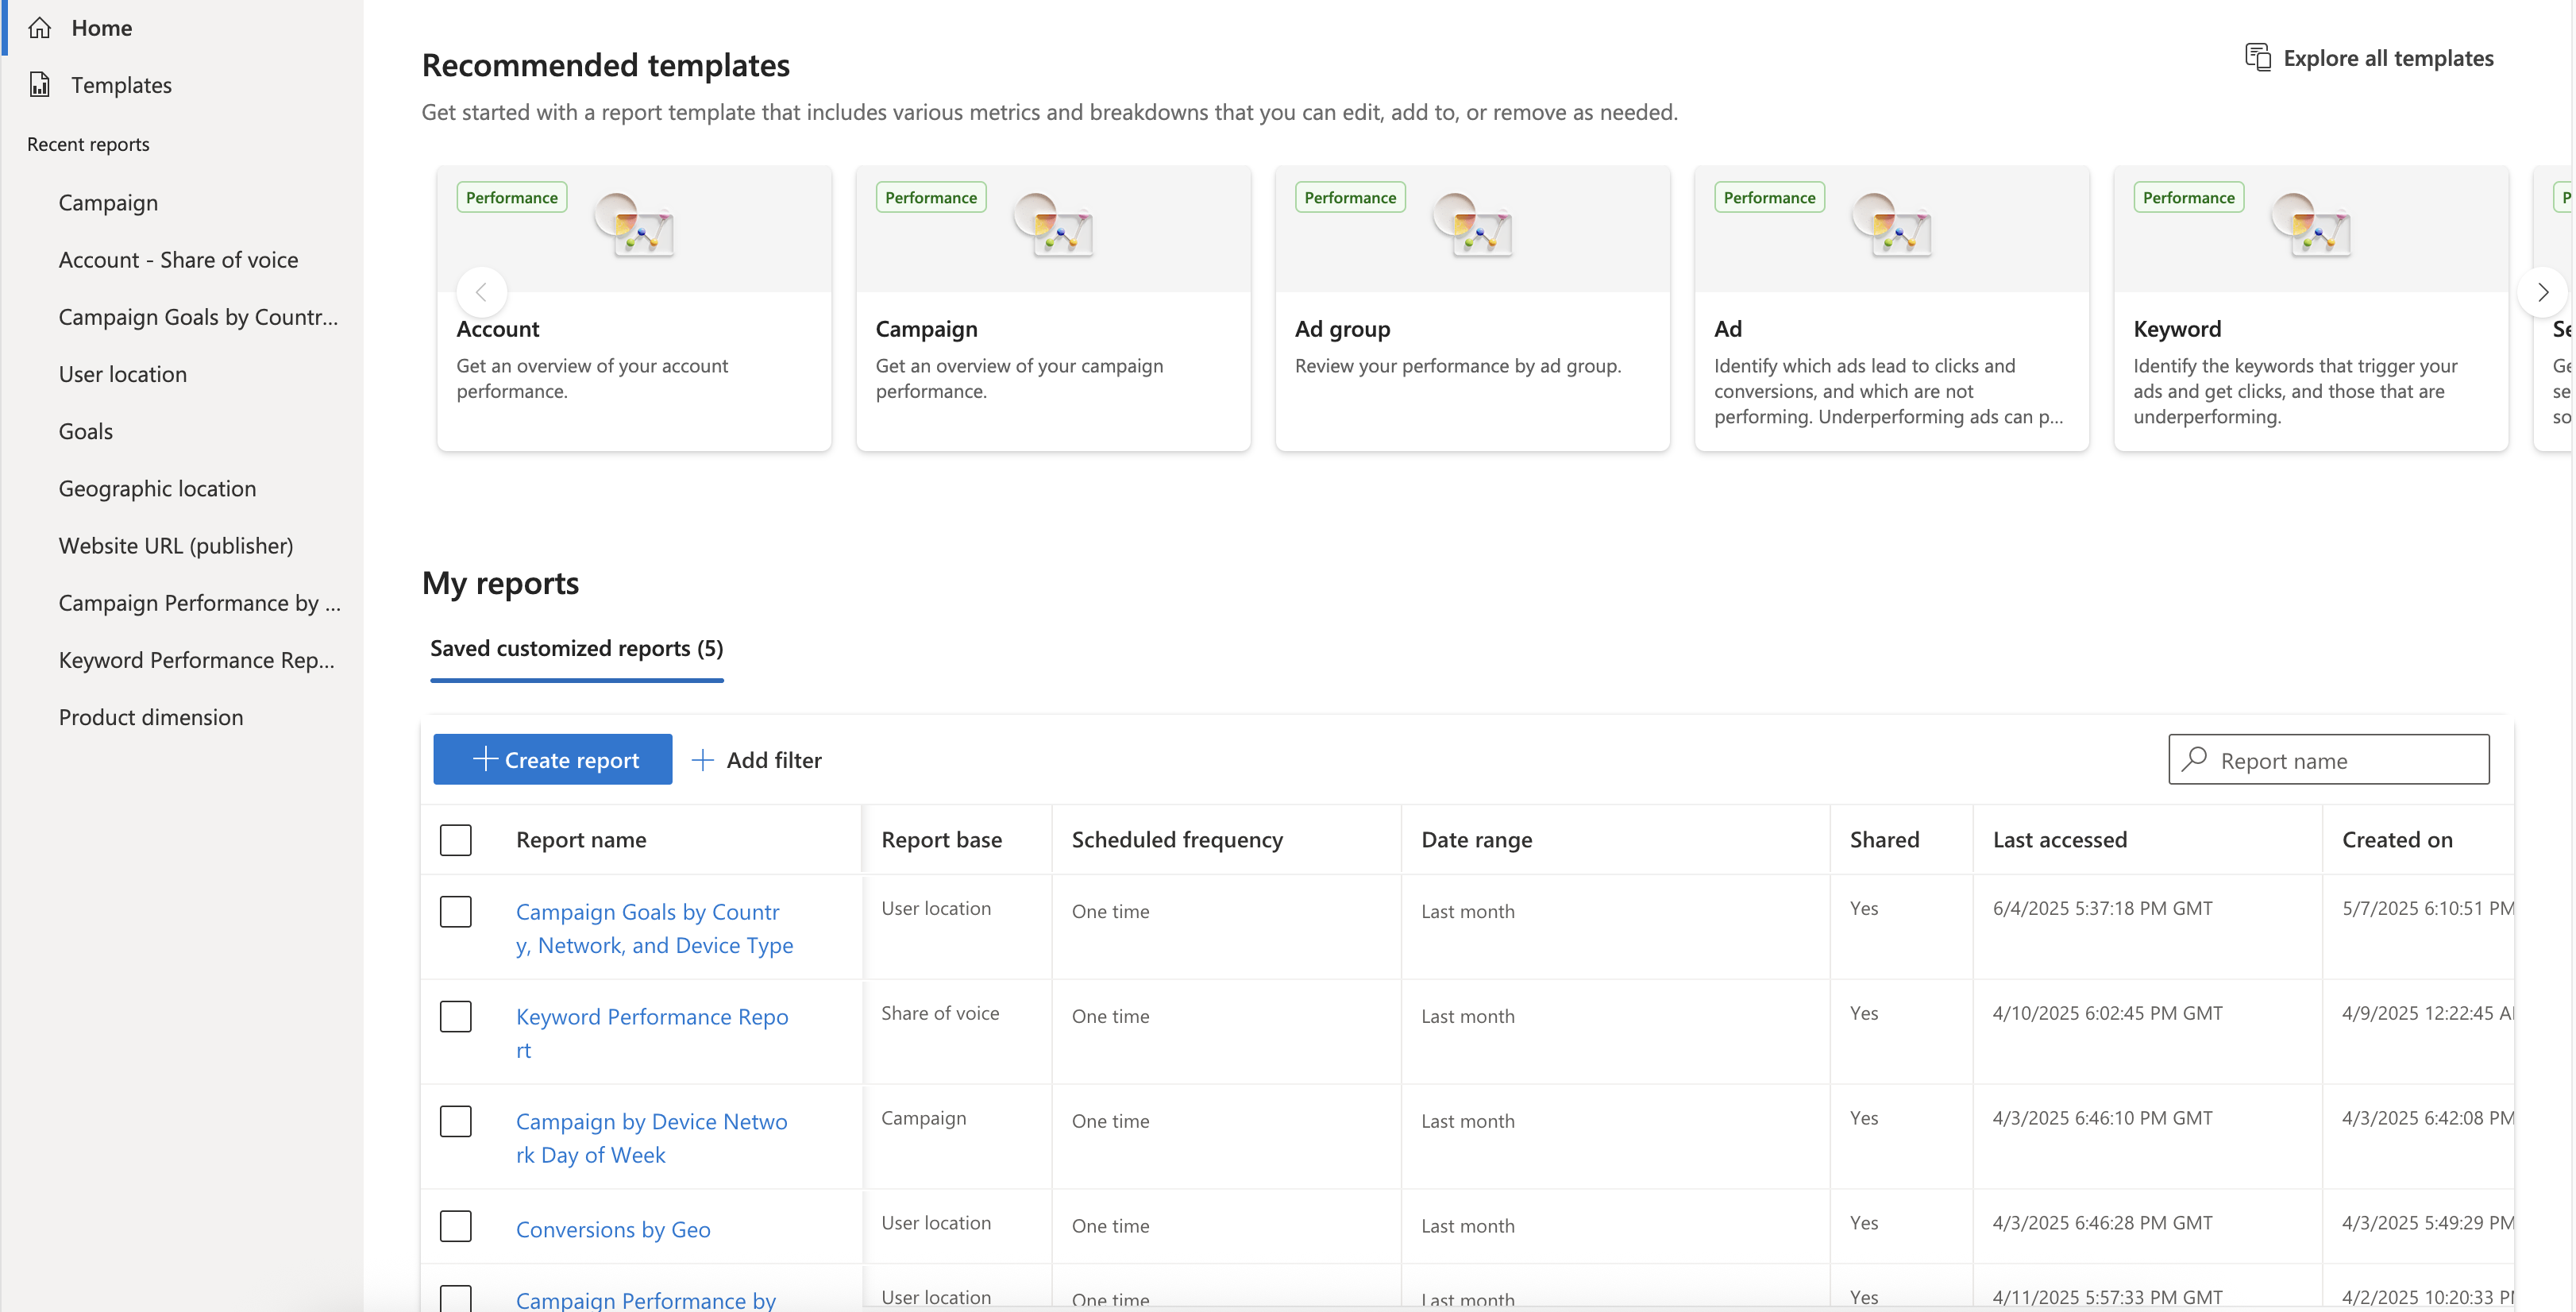
About report templates
Report templates are ready-made reports with predefined metrics and breakdowns—perfect for quickly uncovering insights without setup. Whether you’re new to reporting or need a fast answer, templates are organized by type and searchable to help you find the right fit.
Recommended templates are based on what is currently popular with advertisers, like the Website URL report for engagement across different domains or the Geographic location report for engagement by location.
FAQ
Choose a report template
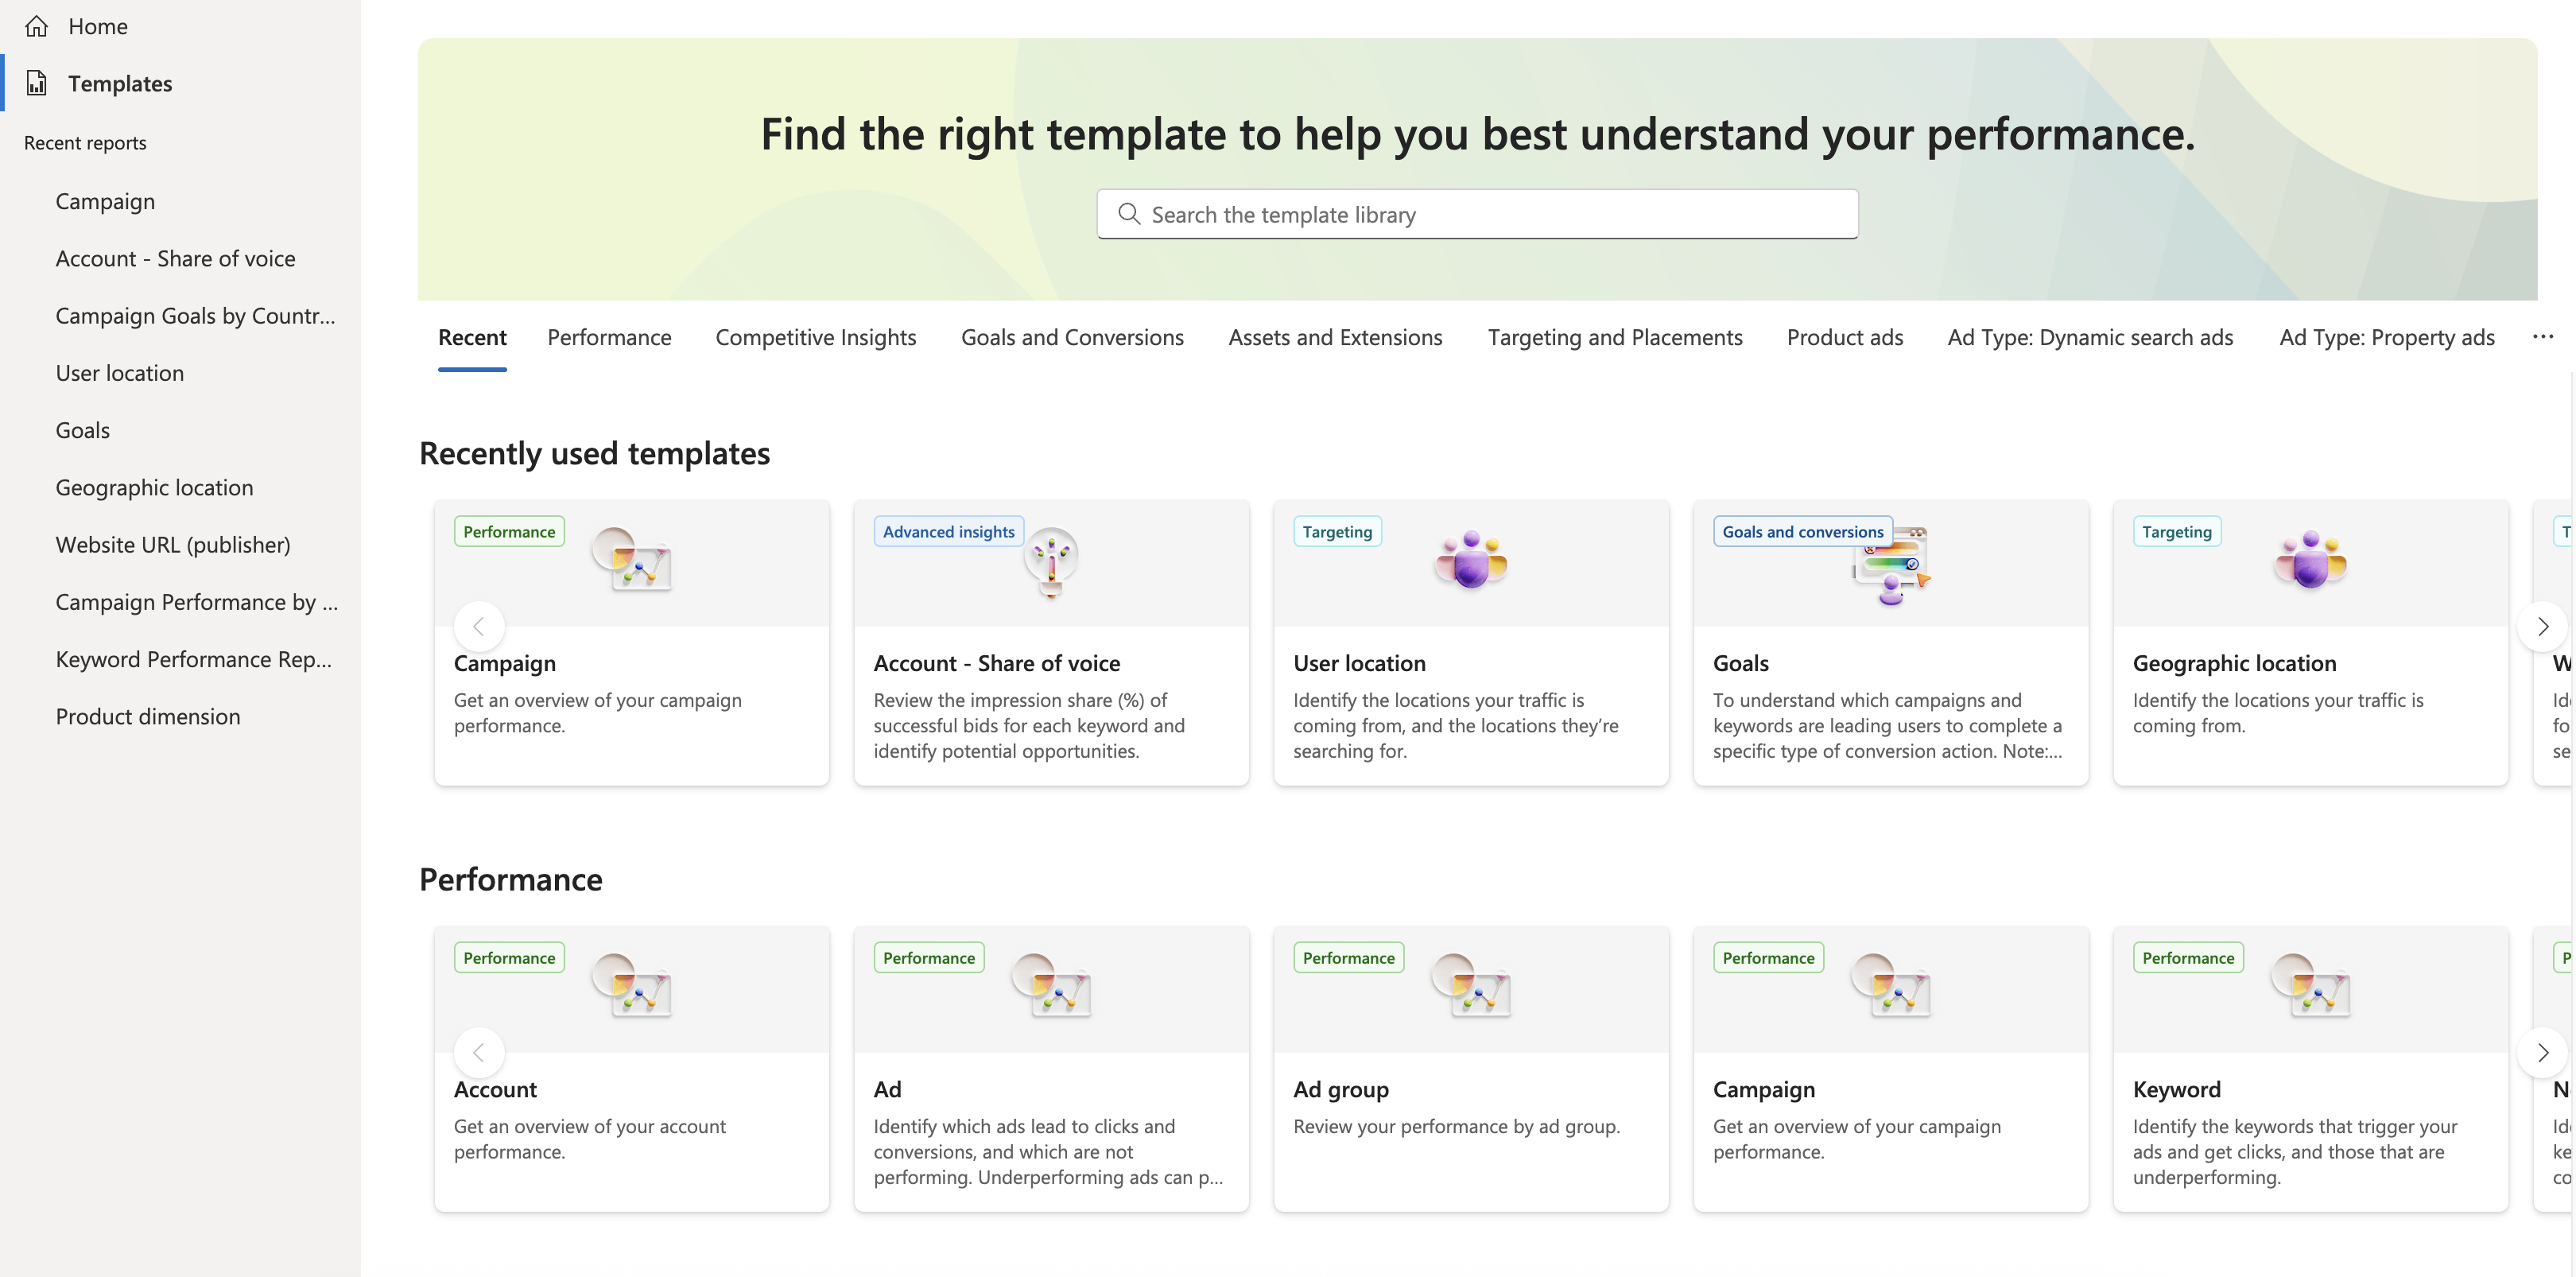
- From the navigation menu on the left, select Reporting > Templates.
- If you don’t find the template that you’re looking for, select Explore all templates to access a comprehensive list sorted by category.
Optionally, you can use the search bar to find specific templates by entering relevant keywords.
Choose the report you want
Each report type breaks out your data in different ways, to help you see deeper into your campaigns' performance. Choose the report type that shows the data most interesting to you:
Performance
Account
What it shows Why run it The impressions, impression share (%), clicks, spend, and average cost per click for individual accounts. This data can be sorted by individual accounts, currency, bid match type, and delivered match type. To observe long-term Microsoft Advertising account performance and trends. Asset
What it shows Why run it The performance of your search (DSA, MMA, and RSA) and Performance Max assets for each account, campaign, or ad group. To identify which assets are performing well and which assets you might consider changing. Campaign
What it shows Why run it The impressions, impression share (%), clicks, spend, and average cost per click for each campaign or account. This data can be sorted by campaign, campaign status, and quality score. To view high-level performance statistics and quality attributes for each campaign or account. This is also a quick way to flag any major campaign or account problems. Combination performance
What it shows Why run it The asset combinations created from Responsive Search ads, Multimedia ads, and Performance Max campaigns To identify the most frequently occurring asset combinations and provide a view of your combination performance. Note
Not everyone has this feature yet. If you don't, don't worry—it's coming soon!
Ad group
What it shows Why run it The impressions, impression share (%), clicks, spend, and average cost per click of your ad groups. This data can be sorted by ad group, ad group status, language, and network. To more broadly compare delivery performance statistics by ad group, campaign, or account attributes, rather than at the keyword level. Ad
What it shows Why run it The impressions, clicks, spend, and average cost per click for each ad. This data can be sorted by ad ID, ad status, ad title(s), display URL, and destination URL. To help you determine which ads lead to clicks and conversions, and which are not performing. Having underperforming ads in your account can pull down the quality of your campaigns. Keyword
What it shows Why run it The impressions, clicks, click-through rate, quality score, quality impact, bid, cost per click, position, and conversions for each individual keyword within your campaign. To find out which keywords are triggering your ads and getting clicks. You can also identify keywords that aren’t performing well, to determine if you want to delete them. Negative keyword conflicts
What it shows Why run it Negative keywords that conflict with some of your keywords, and block your ad from showing. This report tells you which keywords and negative keywords are in conflict, and whether the conflict is at the campaign or ad group level. Use this list to figure out which negative keywords to delete. Search term
What it shows Why run it The impressions, clicks, and click-through rate based on the search terms that have triggered your ads. This data can be filtered for Search campaigns and for Shopping campaigns. To get insight into what your audience is searching for when your ads are shown, as well as ensure that your product titles are relevant to search queries. Note: The Search term report is designed to highlight only the search terms that drive significant volume of impressions, which means the total impressions listed in this report may differ from the total impressions shown in other reports. Search term insights
What it shows Why run it The clicks, impressions, and other performance metrics generated by your search terms. To identify which search terms are driving consumer interest to your campaigns. You can view search term performance per campaign, ad groups and asset group level. Please note that support is only available for Performance Max campaigns. Share of voice
What it shows Why run it The impressions, impression share (%), impression share lost to budget (%), and impression share lost to bid. This data can be sorted by keyword, keyword ID, landing page experience, and quality score.** To view impression share (%) of successful bids for each keyword, and identify opportunities to increase impression share. Destination URL
What it shows Why run it The impressions, clicks, spend, and average cost per click for your landing pages. This data can be sorted by destination URL, account, campaign, and ad group. Note that only the first URL in the list (ad, keyword, or criterion) is reported. To identify landing pages that met audience expectations, resulting in high click or conversion ratios. Website URL (publisher)
What it shows Why run it The impressions, clicks, spend, and conversions for websites on the Microsoft Advertising Network. This data can be sorted by website URL, account, campaign, ad group, and asset group. To see which website URLs are or aren’t performing well enough for your campaign, ad group, or asset group target settings. For example, if ad impressions at those URLs yield a low click-through-rate, then you might decide to exclude those websites from your campaign. Ad dynamic text
What it shows Why run it The impressions, clicks, spend, and average cost per click of your dynamic text strings. This data can be sorted by ad title, destination URL, or the param dynamic text placeholders. To identify which dynamic text strings are performing well and which strings you might consider changing. Rich ad component
What it shows Why run it The component clicks and component click-through rate of your rich ads. This data can be sorted by rich ad subtype, ad title, and component. To view delivery performance of your Rich Ads in Search (RAIS) campaigns. Audiences
What it shows Why run it The impressions, clicks, revenue, and conversions for your audiences. To evaluate performance of remarketing campaigns. Goals
What it shows Why run it The spend, revenue, assists, conversions, and conversion steps of your websites. This data can be sorted by account, ad group, campaign, keyword, and goal. To discover whether visitors who arrive at your website via an Ad click, complete the steps on conversion pages of your website. This report provides data for your conversions’ goals, including UET tags, App Install ads, offline conversions, and historical campaign data. Conversions
What it shows Why run it The conversions, assists, revenue, and revenue per conversion for your campaigns. This data can be sorted by account, ad group, campaign, keyword, and device type. To understand which campaigns and keywords are leading customers to complete conversion actions. This report provides data for your conversions’ goals, including UET tags, App Install ads, offline conversions, and historical campaign data. Ad extensions
Ad extension by keyword
What it shows Why run it The impressions, clicks, spend, and average cost per click of your extensions for each keyword. This data can be sorted by keyword, keyword ID, ad extension type, and ad extension version. To compare how well different versions of your ad extensions are performing for each keyword. Ad extension by ad
What it shows Why run it The aggregated extension impressions, clicks, spend, and average cost per click by ad. This data can be sorted by ad ID, ad title, ad extension type, and ad extension version. To compare how well different versions of your ad extensions are performing with each ad. Ad extension details
What it shows Why run it The impressions, clicks, spend, and average cost per click of individual extension items. This data can be sorted by the individual ad extension property value, ad extension ID, and ad extension type. To discover the effectiveness of individual ad extension items, for example, each link of a sitelink extension. Call forwarding detail
What it shows Why run it The duration for each forwarded call that originated from a call ad extension. To discover which accounts, campaigns, or ad groups are driving the most completed phone calls. Product ads
Product partition
What it shows Why run it The impressions, clicks, spend, average cost per click and average conversion for each product group in your Microsoft Shopping campaigns. To see the performance data for the product groups in your Shopping campaigns and to optimize your campaigns accordingly. Product partition unit
What it shows Why run it The impressions, clicks, spend, average cost per click, and average conversions for each product group in your Microsoft Shopping campaigns. Depending on the report time and columns you choose, the report may include more than one row per product group. To see product partition unit data of your Product Groups in Microsoft Shopping campaigns. Product dimension
What it shows Why run it The impressions, clicks, spend, average cost per click and conversion for each product in your catalog (each line item in Microsoft Merchant Center catalog). To figure out which of your products are triggering ads and getting the most clicks, and optimize the ones not performing so well. Product match count
What it shows Why run it The number of products that are matched and targeted at the campaign, ad group, and product group level. To see if you covered your bidding across the Microsoft Shopping campaigns inventory. Product negative keyword conflicts
What it shows Why run it Shopping negative keywords that conflict with some of your products, and block your ad from showing. This report tells you which products and negative keywords are in conflict, and whether the conflict is at the campaign or ad group level. Use this list to figure out which negative keywords to delete. Product search term report
What it shows Why run it The impressions, clicks, click-through rate, and average position for search terms that have triggered your ads. To see what your audience is searching for when your ads are shown. You can use this information to make informed additions, removals, or edits to both your keyword and negative keyword lists. Change history
Change history
What it shows Why run it A record of changes made to an account, including keyword bid changes, landing page changes, new campaign creations, or when new account budgets are added to the account. To discover when changes to an account were made, as well as which user made them. Targeting
Age and gender
What it shows Why run it The impressions, clicks, spend, and average cost per click for each ad group, organized by gender and age group. To discover how your campaigns and ad groups are resonating with audiences of diverse age and gender. User location
What it shows Why run it The impressions, clicks, spend, and average cost per click for each ad group, organized by city, country, metro area, radius, state, and account. To see which locations your traffic is coming from. You can then validate whether your location targeting strategy is successful, and identify opportunities to improve. Geographic
What it shows Why run it The impressions, clicks, spend, and average cost per click for each ad group, organized into columns that show the location used to serve ads. The location can be where the customers were physically located (location type is physical location) or the location that customers showed interest in (location type is location of interest). To see which locations your traffic is coming from. You can then validate whether your location targeting strategy is successful, and identify opportunities to improve. Professional Demographics
What it shows Why run it The impressions, clicks, spend, and average cost per click for each ad group, organized by company, industry, and job function. To discover how your campaigns and ad groups are resonating with different companies, industries, and job functions. Billing and budget
Budget
What it shows Why run it Your monthly budget, how much you have spent to date, and whether you are on target to spend your monthly budget. To help control and manage your advertising spend for a particular month. Billing statement
What it shows Why run it Billing documents, including invoices and credit memos. To view an overall summary of your billing information. Insertion order (IO) report
What it shows Why run it A summary of your IO expenditures over a specified timeframe. To view your budget changes over time and your IO expenditures for reconciliation purposes. Labels
Keyword
What it shows Why run it The impressions, clicks, click-through rate, quality score, quality impact, bid, cost per click, position, and conversions for each labeled keyword. To organize your keywords into groups based on whatever is important to you.Note:The Search term report is designed to highlight only the search terms that drive significant volume of impressions, which means the total impressions listed in this report may differ from the total impressions shown in other reports. Ad group
What it shows Why run it The impressions, clicks, click-through rate, quality score, quality impact, bid, cost per click, position, and conversions for each keyword with the specified label. To organize your ad groups based on whatever is important to you. Account
What it shows Why run it The impressions, clicks, click-through rate, quality score, quality impact, bid, cost per click, position, and conversions for each account with the specified label. To organize your accounts into groups based on whatever is important to you. Campaign
What it shows Why run it The impressions, clicks, click-through rate, quality score, quality impact, bid, cost per click, position, and conversions for each campaign with the specified label. To organize your campaigns into groups based on whatever is important to you. Dynamic Search ads
Dynamic Search ad auto target
What it shows Why run it The clicks, impressions, and other performance metrics of each of your dynamic ad targets. To understand how your dynamic ad targets are performing and where bid adjustments may be useful. Dynamic Search ad category
What it shows Why run it The clicks, impressions, and other performance generated from your website. To check the performance of your existing category targets or to find new categories worth targeting. Dynamic Search ad search term
What it shows Why run it Search terms that triggered your Dynamic Search ads and their corresponding headlines, final URLs, and associated performance metrics. To see how your ads perform against search terms. The data can help you find negative keywords (so that you're not spending money targeting the wrong customer), as well as the right keywords that create conversions. Modify an existing report template
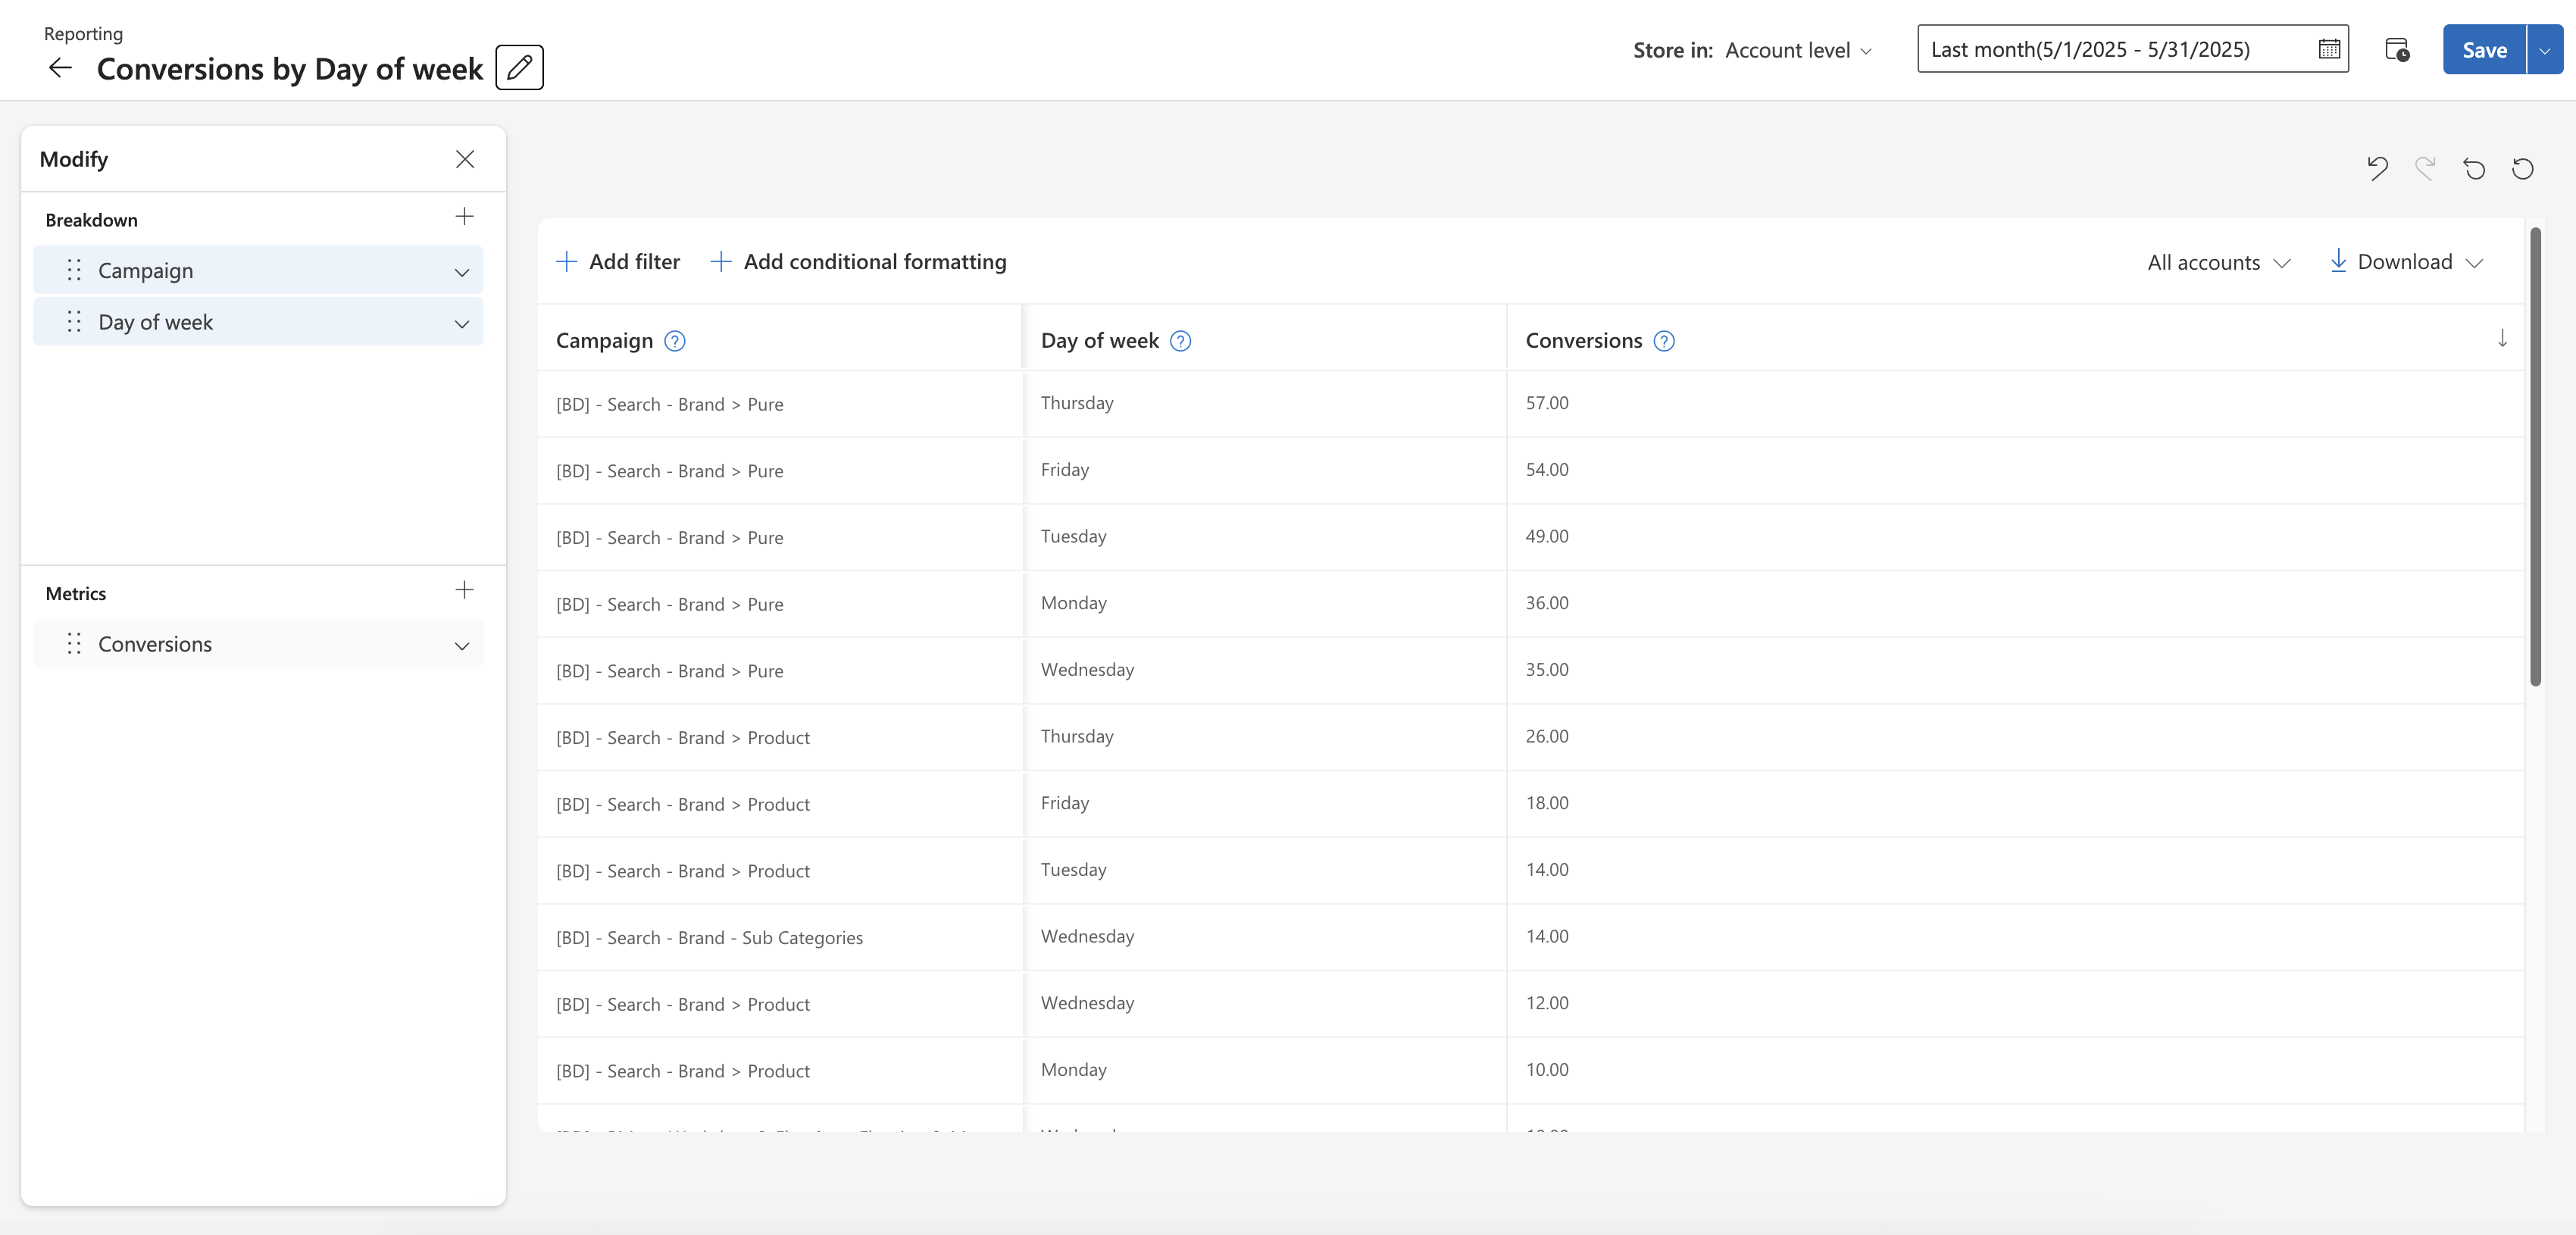
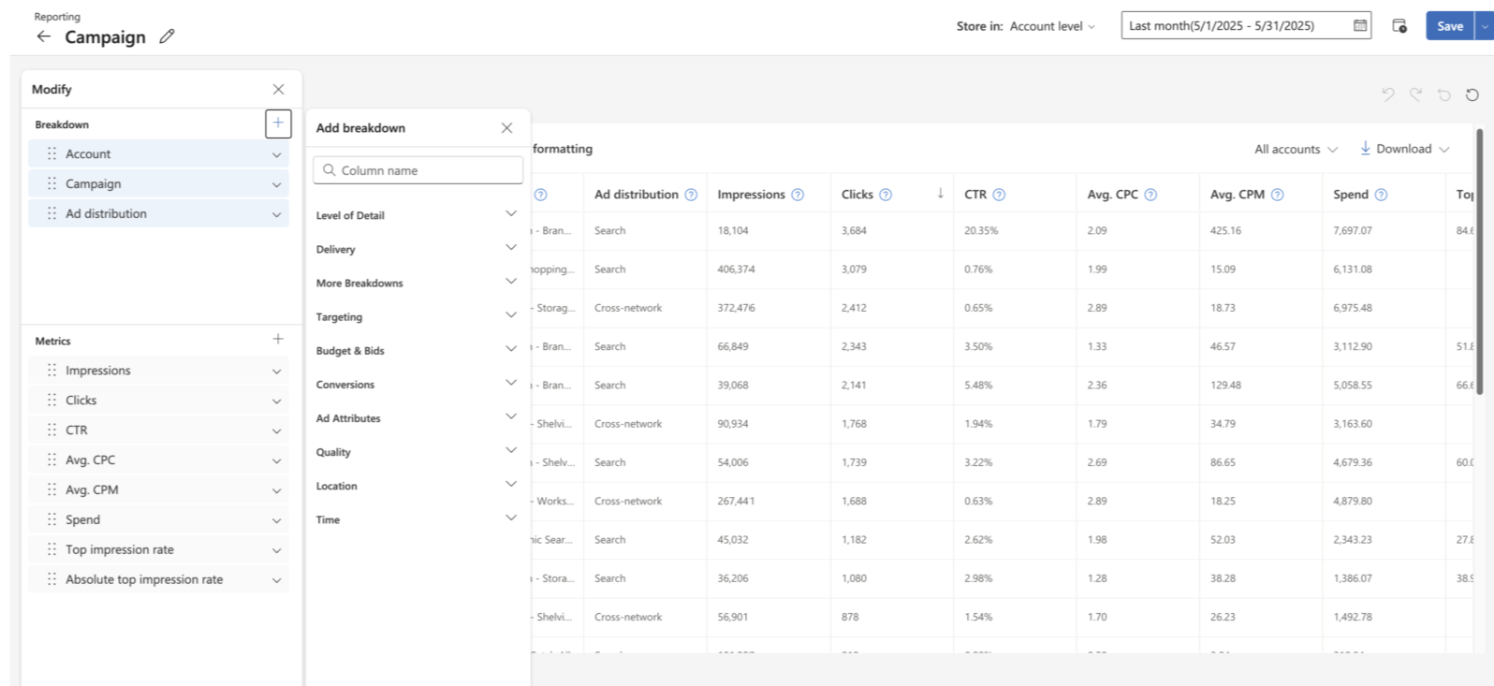
Once you’ve selected a report template, you can customize it using the column modifier to add, reorder, or remove sub-categorized breakdowns and metrics. Metrics serve as performance indicators that measure activities, such as impressions, clicks, or conversions. Breakdowns allow you to categorize your performance metrics into specific groups, such as device type, region, or campaign type.
From the report you want to modify, select Modify above the table.
In the left panel, next to Breakdown or Metrics,
- Select + to add a breakdown or metric.
- Select Expand > Remove next to a breakdown or metric to remove it.
In the left panel, you can rearrange the column order of Breakdown or Metrics by selecting to place in your desired order.
Once you’re finished with the modifications, select Save from the upper right corner of the report.
Visualize your report with graphs
Graphs let you transform raw numbers into visual understanding. Whether applying a preset template or designing your own report, graphs simplify identifying patterns, comparing results, and communicating findings. Within the Graphs section, you can:
- Select a visualization style: Bar chart, line graph, pie chart, or overview table
- Apply breakdowns and choose metrics with the column editor
- How to access graphs: You can open the Graphs tab in two ways:
- From a report template: Select a report template (such as Age and gender). From the Graphs tab, you can use the data visualizations based on the template's data to start building graphs based on this report.
- From a custom report
- Select Create report, build your report table with breakdowns and metrics, then switch to the Graphs tab.
- From the Graphs tab, you can use the data visualizations to start building graphs based on this report.
Note
Graphs are generated from table data. If your table is empty, add breakdowns and metrics before creating a graph.
- Graph configurations: Each graph type supports a specific number of breakdowns and metrics:
Graph type Breakdowns Metrics Bar chart 1 Up to 2 Line chart 1 Up to 2 Pie chart 1 1 Summary table Up to 3 Up to 3 - Exporting reports and graphs: You can export your graphs as a CSV or JPEG file. Choose from the following options:
- Report only: Exports the data table without any graphs.
- Report and graphs: Exports both the data table and all associated graphs.
- All graphs: Exports all graphs without the data table.
- Graph: Exports only the graph you select.
Note
When you save a report, both the table and graphs are saved.
Set the report frequency
- Open the report you want to schedule.
- In the side panel, select Schedule frequency.
- From the dropdown menu, choose the desired frequency (e.g., daily, weekly, monthly).
- Set the start date and time for report generation.
- Select Save.
Note
- You can select metrics for time under the column selector menu.
- Remember, effects of any updates you make to campaigns can take up to a couple of weeks to show in report data. So, consider running performance reports in two- to four-week intervals.
- You can regularly run reports either manually using those saved in Reports history, or by scheduling reports to automatically run on a regular basis.
Download your reports
- Open the report you want to download.
- In the upper right corner of the table, select Download.
- From the dropdown menu, choose your preferred file type: .zip (CSV), .zip (TSV), or .xlsx.
- The download will begin automatically.
Save and schedule your reports
Whether you create a report from scratch using the Report Builder or by customizing a template, the final step is to save. You can also schedule your report for regular delivery, as well as customize and save a report to run it again in the future.
- After creating and customizing your report, select Save.
- In the panel, select a name for your report.
- Choose a location to save it.
- Optionally, add a description to help identify the report later.
- Select Save.
Note
You’ll also see an option to store the report at the account level or account and user profile level. At the account level, all users that have access to the account can access the report. If you save a report at the account and user profile level, the custom report will be accessible across all accounts your profile has access to, allowing for scalable use across accounts you manage.
Note
- After you save your report, it will show in the left pane under Recent reports.
- To access your saved reports, from Home, under My reports, select Saved customized reports.
- You can rename your report to help you more easily find and reuse your custom report. From the Report name column, hover over the report you want to rename, then select the pencil icon.
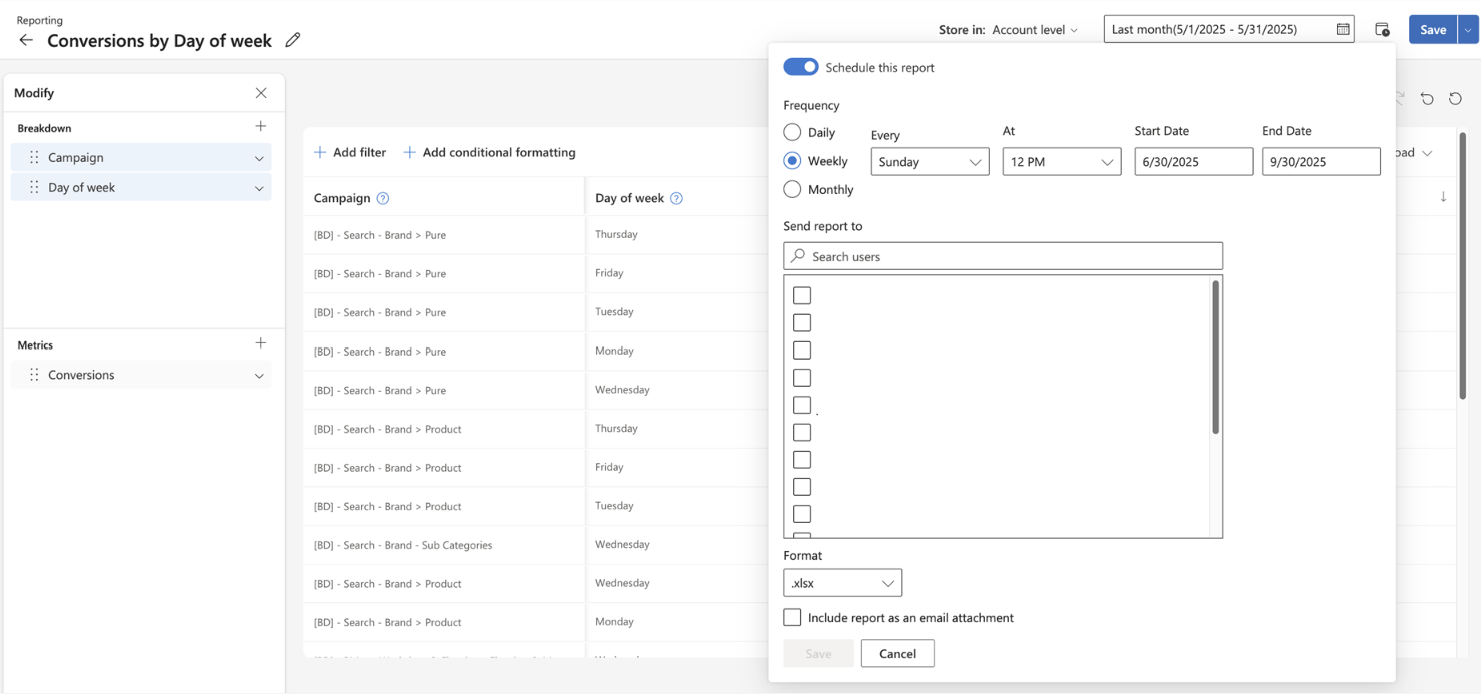
Schedule or email your report
- From the report you want to schedule, in the summary bar at the top of the report preview, select Schedule report.
- Turn on the Schedule this report toggle.
- Select the frequency, day of the week, time of day, start date, and end date for the scheduled report.
- Choose the email address where you want to send the report, select Send report to.
- To select the desired format of the report, select Format.
- If you want the report sent as an attachment, select Include report as an email attachment.
- Select Save.
Important
Send report to will only allow you to email/share the report with users that have access to the appropriate entity.
Note
- To access your scheduled reports, under My reports, selectSaved customized reports.
- As of August 1st, 2019 all new reports must be scheduled to run on one of the first 28 days of the month and set to one of the following frequencies: Daily, Weekly, or Monthly. Please note that this will not impact your existing scheduled reports.
Cancel a scheduled report
- From the navigation menu on the left, select Reporting > Home > Saved customized reports.
- From the Saved customized reports grid, find the scheduled report you want to cancel and select Delete.
Unsubscribe from report notifications
You can always opt out of receiving scheduled report notifications, even if you created the report yourself. There are two ways to do so.
Option 1:
In the footer of a scheduled report email, select Unsubscribe from this scheduled report.
Option 2:
- From the navigation menu on the left, select Reporting > Home.
- Select My reports and find the Edit scheduled frequency column. Clear the checkbox to unsubscribe from report notifications.