Share via

MS Project swimlanes

Anonymous
2022-03-09T01:32:11+00:00

Any tips on presenting MS project gantt chart with swimlanes within MS projects out of the box functionality? quick google search seems to only show methods using add-ins.

Microsoft 365 and Office | Project | For business | Windows

Locked Question. This question was migrated from the Microsoft Support Community. You can vote on whether it's helpful, but you can't add comments or replies or follow the question.

0 comments No comments

Answer accepted by question author

  1. Anonymous
    2022-03-10T02:40:36+00:00

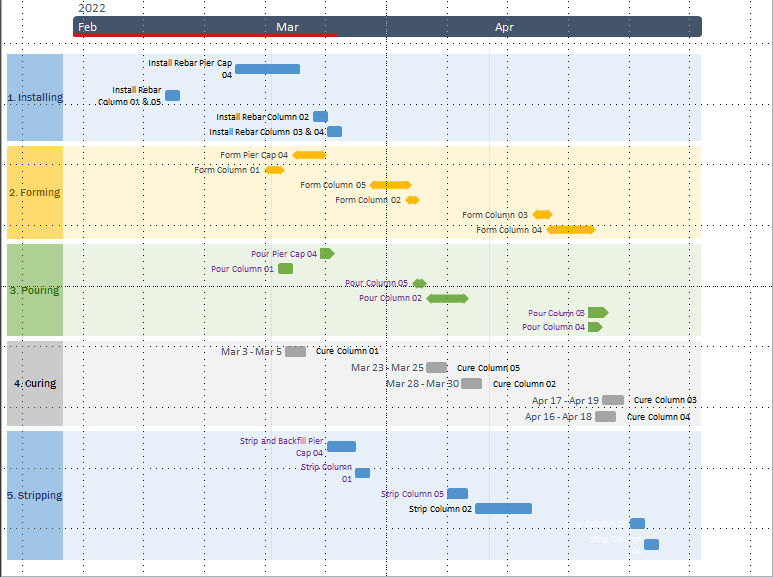
    What you have there is an Office Timeline template, and specifically one of the swimlane templates.

    Office Timeline is an add in for powerpoint. It imports data from MSP or excel files into powerpoint slides, where you can easily get carried away with extra formatting to dress it up.

    You can get a fair way towards it in MSP, with grouping and styles, but not exactly, such as the background shading.

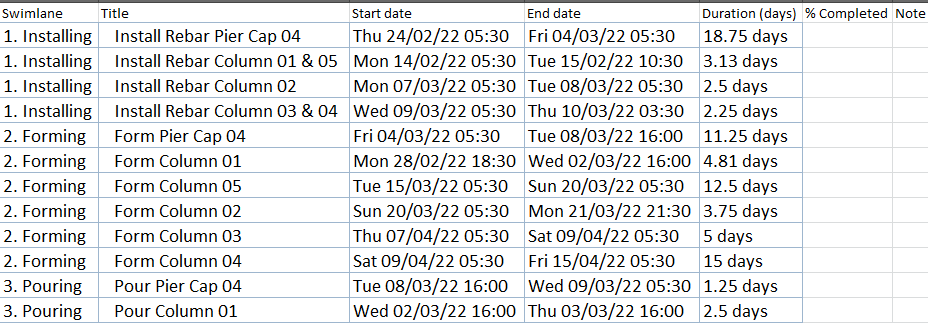
    If you copy the MSP data and paste it into an excel sheet and shuffle it around so it is set it up properly, you can import the data into Office Timeline and apply the template. Like this:

    What the excel sheet has to look like.

    4 people found this answer helpful.
    0 comments No comments

4 additional answers

Sort by: Most helpful
  1. Anonymous
    2022-03-09T06:53:25+00:00

    Thanks for the tip, that seems to work in grouping the tasks.

    Any tips on how to generate a chart that looks like this in MS project.

    All the research points to 3rd party add ins which seems silly for simple reporting

    2 people found this answer helpful.
    0 comments No comments
  2. John Project 49,705 Reputation points Volunteer Moderator
    2022-03-09T02:01:07+00:00

    SP8_166,

    How about using grouping on the Gantt Chart view. Set up a custom field (e.g. Text1) to identify each of the swimlane categories. Then group on that field.

    John

    1 person found this answer helpful.
    0 comments No comments
  3. Anonymous
    2022-03-10T00:08:48+00:00

    What is this above? A visio swimlane template?

    This is an example of grouping on Text1 and using flags to obtain the bar styles (just different colours).

    Before grouping:

    After Grouping on Text1

    0 comments No comments
  4. John Project 49,705 Reputation points Volunteer Moderator
    2022-03-09T16:24:55+00:00

    SP8_166,

    Sorry, but Project simply does not have the built-in ability to create the swimlane format you show. Increased reporting capability was added to Projects with the release of Project 2013 but it is focused on dashboard/chart type reports. Perhaps a swimlane type report will be added to Project in a future release. I suggest you submit a request via File > Feedback.

    For now, I see two approaches to get the format you want. One is via 3rd party add ins as you have found and the other is via a VBA export to Excel which has much more flexibility in creating custom reports.

    John

    0 comments No comments