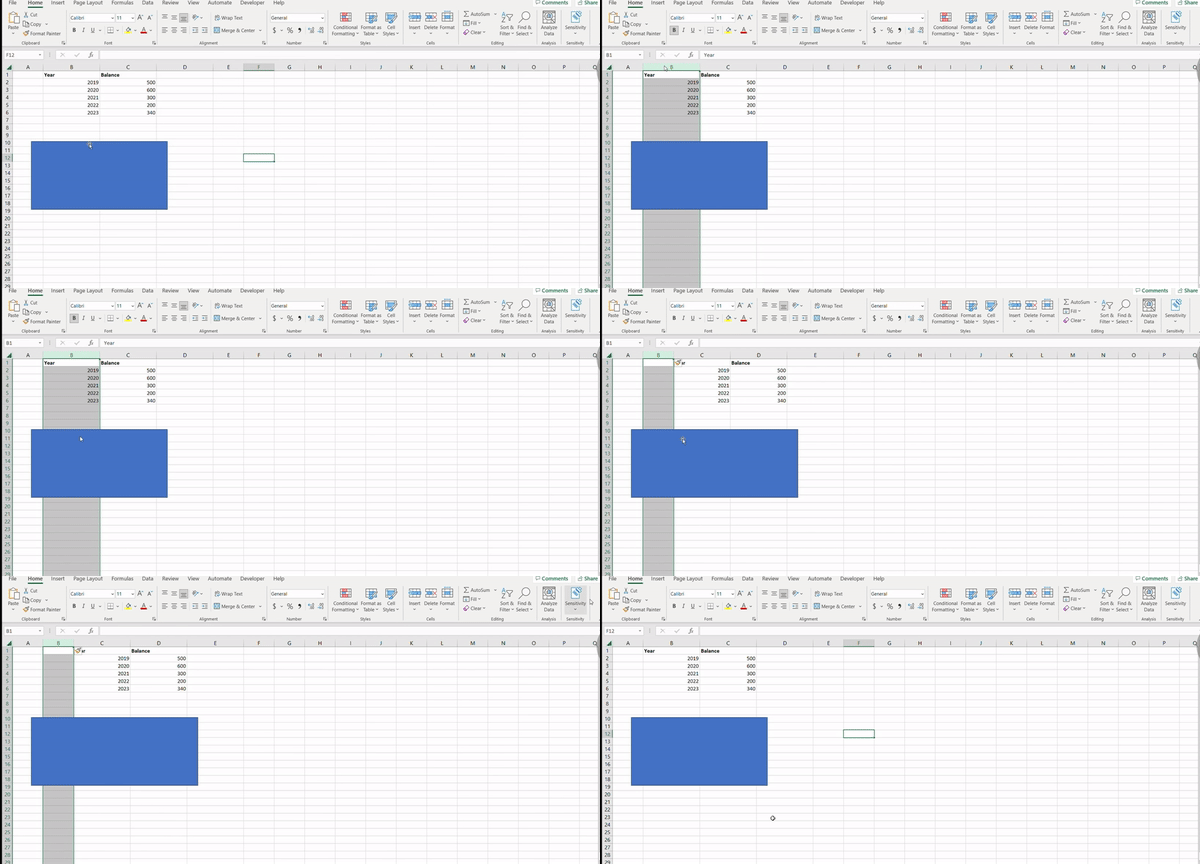
I'm working on a project that involves manipulating Excel files programmatically using the Open XML SDK. Currently, I'm facing a challenge regarding updating the positions of shapes/Charts within the worksheet after inserting new columns. I've reviewed the Open XML documentation and tried different approaches, but I'm encountering difficulties with the specific XML structure of shapes and their anchor positions. Below GIF is to explain what I am trying to achieve. In Excel when you select a column, rmb and select to 'Insert' a new column will be inserted and if there are any shapes or charts in the affected area, they are expanded accordingly. I am trying to achieve this using open XML SDK.

As shown in the GIF my goal is to achieve the following:
- Insert a new column into the worksheet.
- Update the positions of shapes/Charts within the affected range so that they align correctly with the new column (Expansion of shapes and charts).
I've attempted to use the TwoCellAnchor approach, as recommended in various resources, but I'm having trouble understanding the exact structure of the XML elements and attributes involved in updating the position of shapes/Charts.
I've noticed that classes like Xdr.Marker, A.ColumnId, and A.ColOffset have been suggested in previous discussions, but these classes do not seem to directly address the issue. I'm struggling to identify the correct classes and properties to manipulate in order to achieve the desired results.
Could someone with experience in working with Open XML and manipulating shape positions help shed some light on this? Are there any specific classes or methods I should be using, or is this a limitation in the Open XML SDK? Any guidance, code snippets, or examples would be greatly appreciated.
Thank you in advance for your assistance.
Below is my current code which inserts 3 new columns after column index 1.
using System;
using DocumentFormat.OpenXml;
using DocumentFormat.OpenXml.Packaging;
using DocumentFormat.OpenXml.Spreadsheet;
using A = DocumentFormat.OpenXml.Drawing;
using Xdr = DocumentFormat.OpenXml.Drawing.Spreadsheet;
using System.Collections.Generic;
using System.Linq;
using System.Text;
using System.Threading.Tasks;

namespace insetNewColumnChart
{
    internal class numberOfColumns
    {
        static void Main(string[] args)
        {
            using (SpreadsheetDocument document = SpreadsheetDocument.Open(@"C:\Temp\Chart.xlsx", true))
            {
                string sheetName = "Sheet1"; // Replace with your sheet name
                int columnIndexToInsertAfter = 1;   // Column index to insert after (e.g., 2 for column B)

                InsertColumnsAfterIndex(document, sheetName, columnIndexToInsertAfter);
            }

        }
        static void InsertColumnsAfterIndex(SpreadsheetDocument document, string sheetName, int columnIndex)
        {
            Sheet sheet = document.WorkbookPart.Workbook.Descendants<Sheet>().FirstOrDefault(s => s.Name == sheetName);

            if (sheet != null)
            {
                WorksheetPart worksheetPart = (WorksheetPart)document.WorkbookPart.GetPartById(sheet.Id);
                Worksheet worksheet = worksheetPart.Worksheet;

                // Check if the column collection exists
                Columns cs = worksheet.Elements<Columns>().FirstOrDefault();

                if (cs == null)
                {
                    SheetData sd = worksheet.Elements<SheetData>().FirstOrDefault();

                    if (sd != null)
                    {
                        cs = worksheet.InsertBefore(new Columns(), sd);
                    }
                    else
                    {
                        cs = new Columns();
                        worksheet.Append(cs);
                    }
                }

                // Define the width and index range for the new columns
                Column newColumn = new Column
                {
                    Min = (UInt32Value)(columnIndex + 1U),  // Columns are 1-indexed
                    Max = (UInt32Value)(columnIndex + 3U),
                    Width = 20,
                    CustomWidth = true
                };

                cs.Append(newColumn);

                // Update cell references in formulas
                foreach (Cell cell in worksheet.Descendants<Cell>())
                {
                    if (cell.CellFormula != null)
                    {
                        string formula = cell.CellFormula.Text;
                        cell.CellFormula.Text = UpdateFormulaReferences(formula, columnIndex, 3);
                    }
                }

                worksheetPart.Worksheet.Save();
            }
            else
            {
                Console.WriteLine("Sheet not found.");
            }
        }

        static string UpdateFormulaReferences(string formula, int columnIndex, int numberOfColumns)
        {
            for (int i = 0; i < numberOfColumns; i++)
            {
                string oldColumnReference = GetCellReference(columnIndex + i, 1);
                string newColumnReference = GetCellReference(columnIndex + i + numberOfColumns, 1);
                formula = formula.Replace(oldColumnReference, newColumnReference);
            }
            return formula;
        }

        static string GetCellReference(int columnIndex, int rowIndex)
        {
            // Convert column index to column name (e.g., 1 -> A, 2 -> B, ...)
            int dividend = columnIndex;
            string columnName = String.Empty;
            int modulo;

            while (dividend > 0)
            {
                modulo = (dividend - 1) % 26;
                columnName = Convert.ToChar(65 + modulo) + columnName;
                dividend = (dividend - modulo) / 26;
            }

            return columnName + rowIndex;
        }
    }
}
