I need to make a timechart of concurrent VPN users connected to my Cisco ASA like the one in the following screenshot:
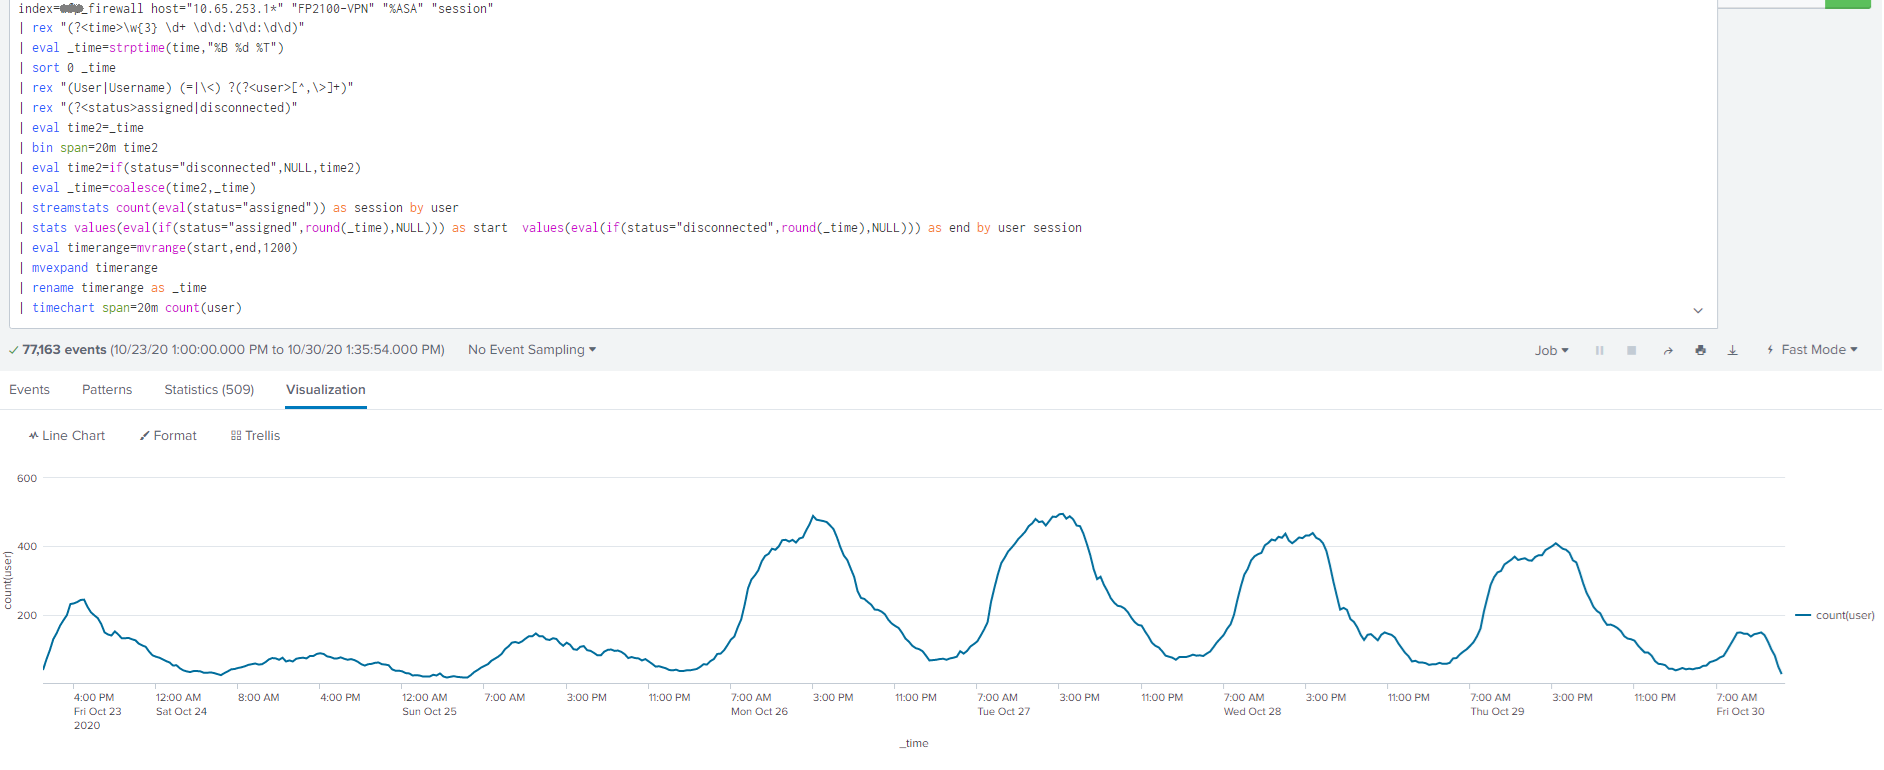
In splunk it was made possible by the awesome query posted here:
https://community.splunk.com/t5/Splunk-Search/Concurrent-Active-VPN-Sessions-on-a-Timechart/m-p/493141#M137524
If I have to use the same logic to achieve the desired result, I just need your help to convert the following part of the above splunk query into KQL:
| sort 0 _time | eval time2=_time | bin span=20m time2 | eval time2=if(status="disconnected",NULL,time2) | eval _time=coalesce(time2,_time) | streamstats count(eval(status="assigned")) as session by user | stats values(eval(if(status="assigned",round(_time),NULL))) as start values(eval(if(status="disconnected",round(_time),NULL))) as end by user session | eval timerange=mvrange(start,end,1200) | mvexpand timerange | rename timerange as _time | timechart span=20m count(user)
' cx='32' cy='32' r='32' /%3E%3Ctext x='50%25' y='55%25' dominant-baseline='middle' text-anchor='middle' fill='%23FFF' %3EPK%3C/text%3E%3C/svg%3E)
' cx='32' cy='32' r='32' /%3E%3Ctext x='50%25' y='55%25' dominant-baseline='middle' text-anchor='middle' fill='%23FFF' %3EMT%3C/text%3E%3C/svg%3E)