Hi to everyone, i had a problem with my laptop, detected this after the sound began to buzzle and freeze while executing working programs such as Android Studio and others (sometimes this happens during meetings).
Struggling with this for more than 2 months, if no additional programs run the sound is perfect, and when Windows launching the greeting sound is always freezing too(in that case disabling quick boot helps).
What i have already tried:
- updated drivers
- rollbacked drivers
- updated bios
- rollbacked bios
- update windows
- Restored Windows to factory settings
- changing power settings to max productivity
- in clean boot the issue is not disappeared
- in cmd
sfc /scannow
DISM /Online /Cleanup-Image /RestoreHealth
DISM /Online /Cleanup-Image /CleanHealth
- something else but I do not remember
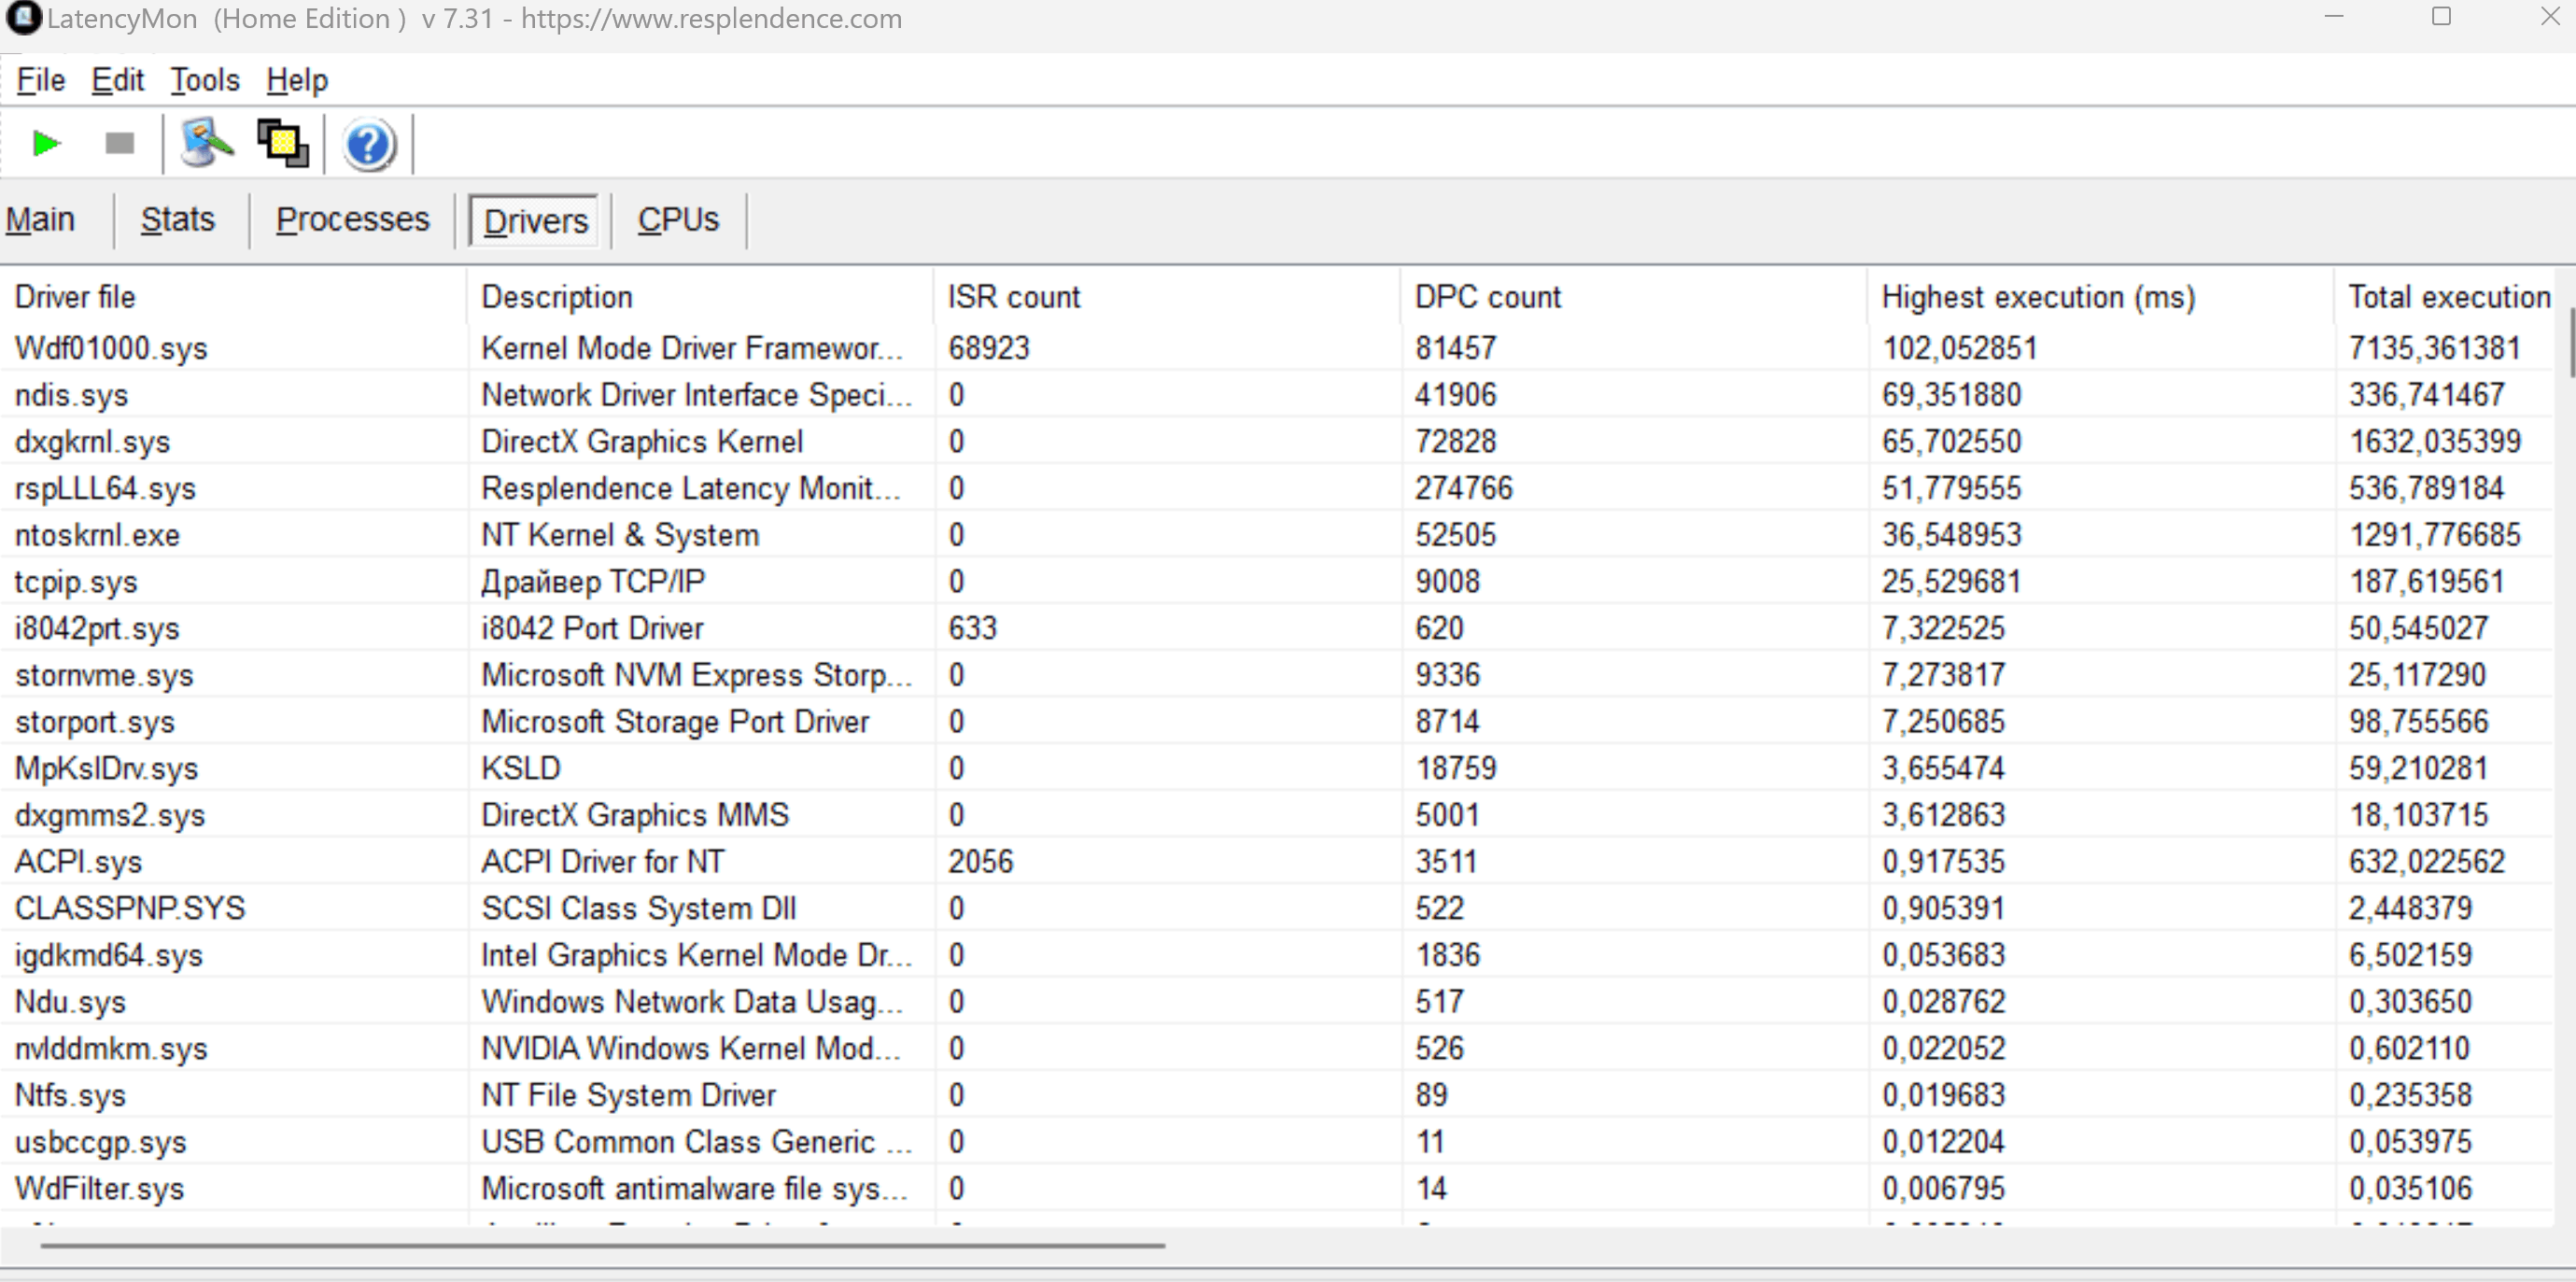
wdf01000,
nvlddmkm
dxgrln
ACPI
ntoskrkln
some of them always with very high DPC, depending on what program I use and some other conditions that I do not know, sometimes launching the same program shows different drivers with high DPC but in half of the cases it is wdf01000
P.S. u can write your suggestions advice and questions in English or Ukrainian or Russian. Thanks
CONCLUSION
_________________________________________________________________________________________________________
Your system appears to be having trouble handling real-time audio and other tasks. You are likely to experience buffer underruns appearing as drop outs, clicks or pops. One or more DPC routines that belong to a driver running in your system appear to be executing for too long. Also one or more ISR routines that belong to a driver running in your system appear to be executing for too long. At least one detected problem appears to be network related. In case you are using a WLAN adapter, try disabling it to get better results. One problem may be related to power management, disable CPU throttling settings in Control Panel and BIOS setup. Check for BIOS updates.
LatencyMon has been analyzing your system for 0:21:00 (h:mm:ss) on all processors.
_________________________________________________________________________________________________________
SYSTEM INFORMATION
_________________________________________________________________________________________________________
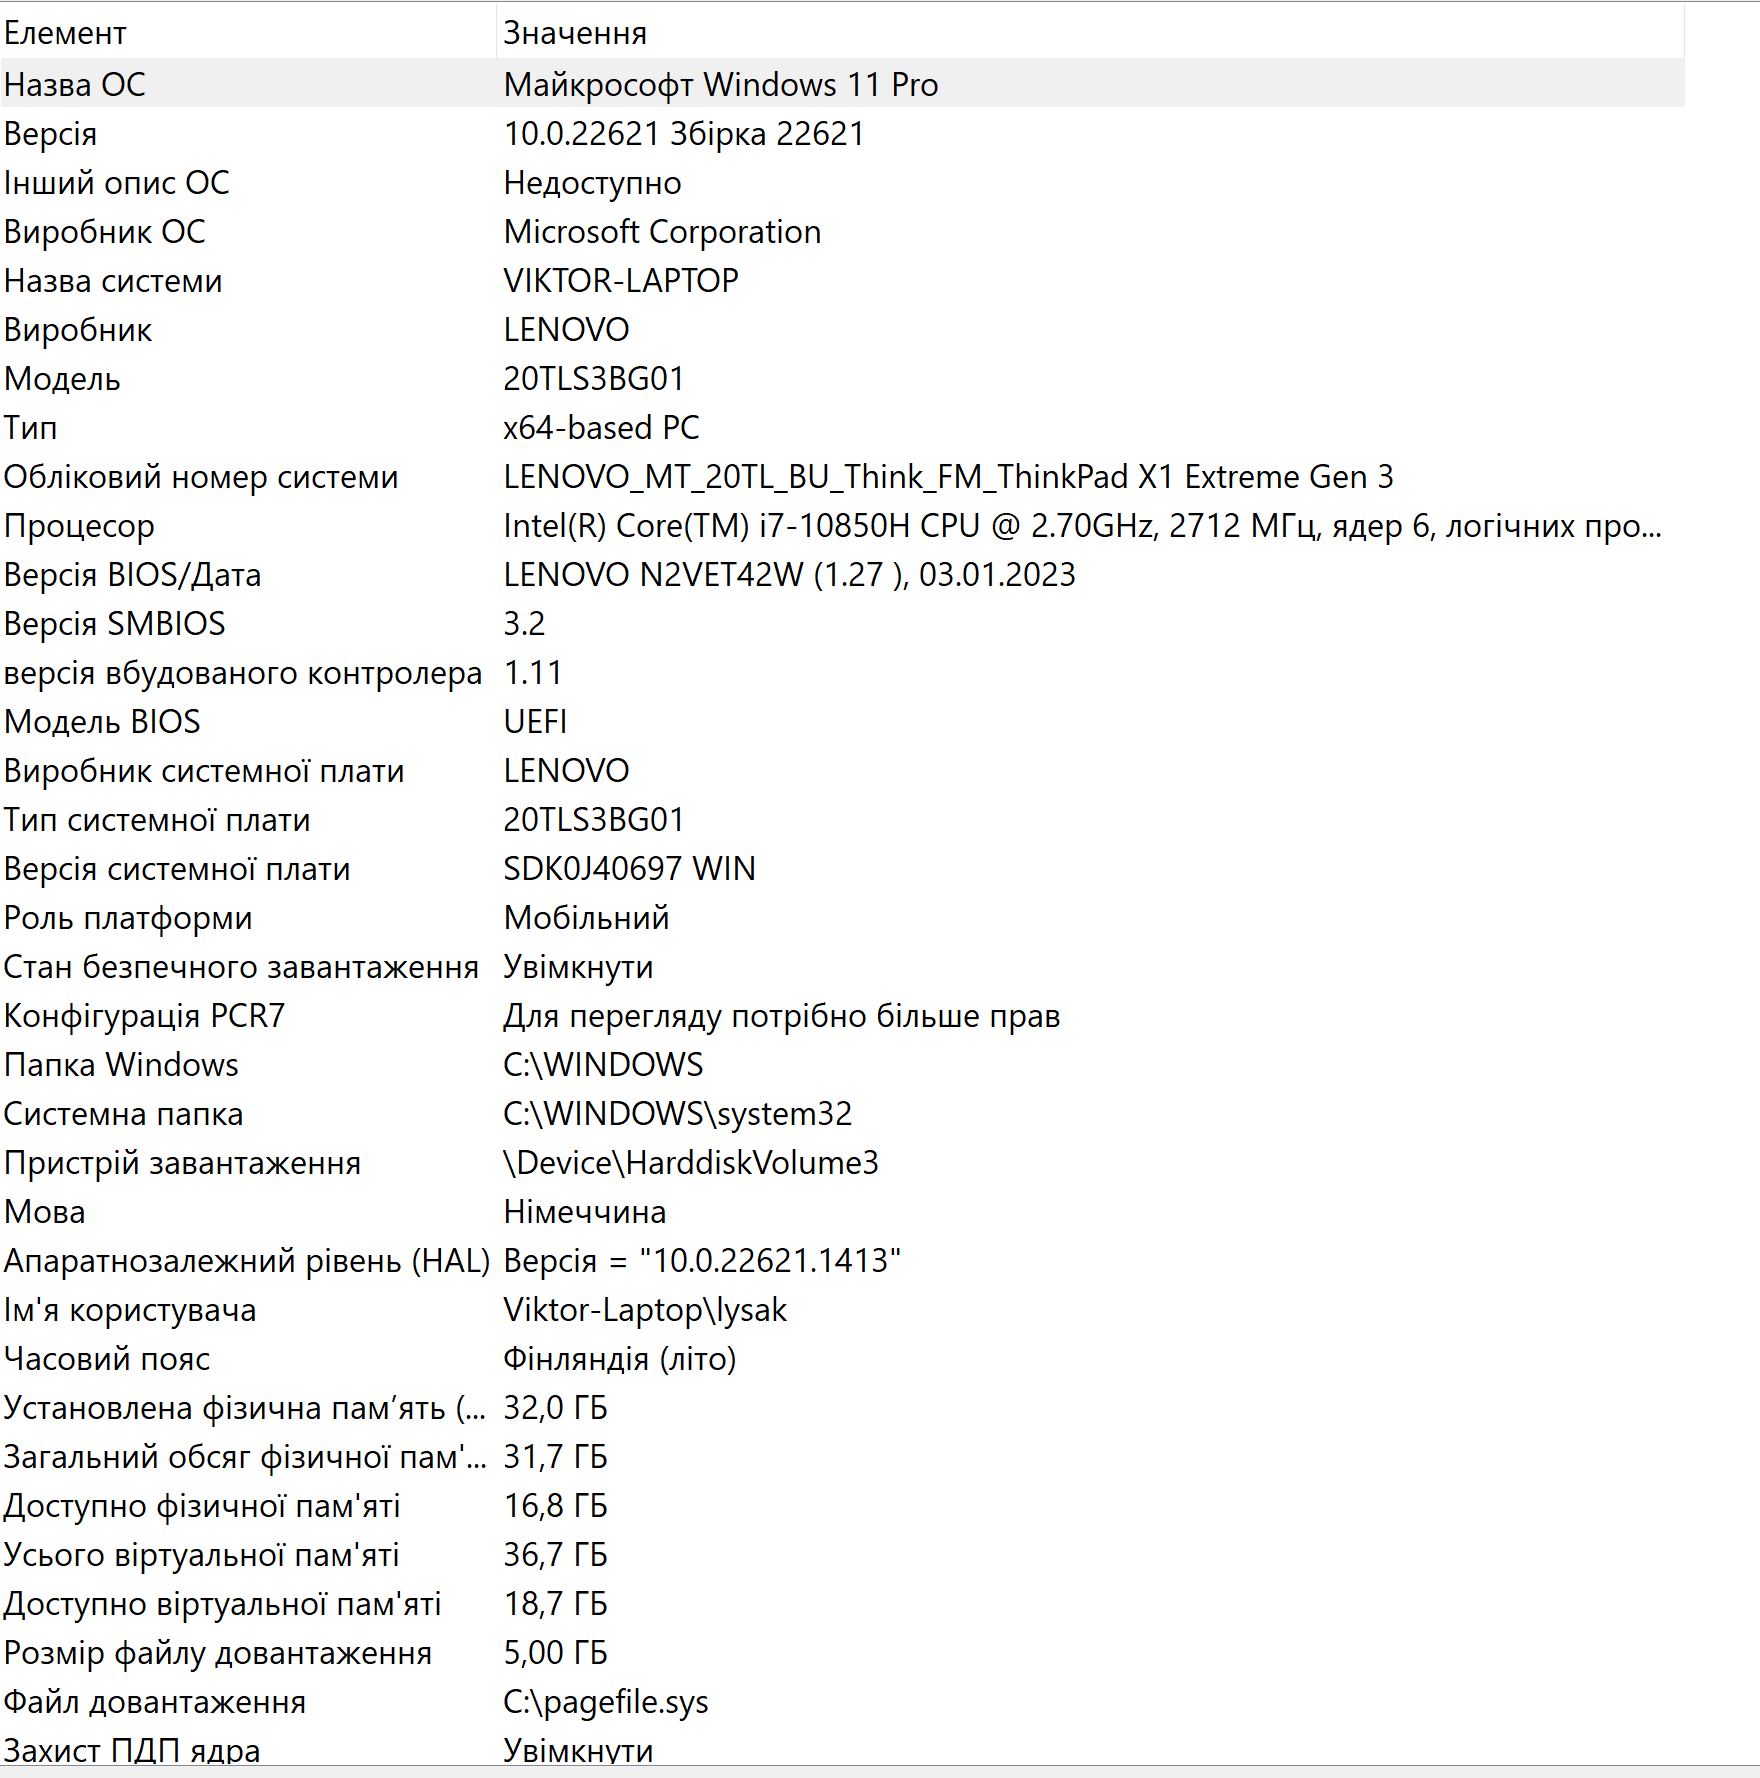
Computer name: VIKTOR-LAPTOP
OS version: Windows 11, 10.0, version 2009, build: 22621 (x64)
Hardware: 20TLS3BG01, LENOVO
BIOS: N2VET42W (1.27 )
CPU: GenuineIntel Intel(R) Core(TM) i7-10850H CPU @ 2.70GHz
Logical processors: 12
Processor groups: 1
Processor group size: 12
RAM: 32487 MB total
_________________________________________________________________________________________________________
CPU SPEED
_________________________________________________________________________________________________________
Reported CPU speed (WMI): 2310 MHz
Reported CPU speed (registry): 2712 MHz
Note: reported execution times may be calculated based on a fixed reported CPU speed. Disable variable speed settings like Intel Speed Step and AMD Cool N Quiet in the BIOS setup for more accurate results.
_________________________________________________________________________________________________________
MEASURED INTERRUPT TO USER PROCESS LATENCIES
_________________________________________________________________________________________________________
The interrupt to process latency reflects the measured interval that a usermode process needed to respond to a hardware request from the moment the interrupt service routine started execution. This includes the scheduling and execution of a DPC routine, the signaling of an event and the waking up of a usermode thread from an idle wait state in response to that event.
Highest measured interrupt to process latency (µs): 182839,10
Average measured interrupt to process latency (µs): 16,999999
Highest measured interrupt to DPC latency (µs): 182835,50
Average measured interrupt to DPC latency (µs): 11,000308
_________________________________________________________________________________________________________
REPORTED ISRs
_________________________________________________________________________________________________________
Interrupt service routines are routines installed by the OS and device drivers that execute in response to a hardware interrupt signal.
Highest ISR routine execution time (µs): 36390,907448
Driver with highest ISR routine execution time: Wdf01000.sys - Kernel Mode Driver Framework Runtime, Microsoft Corporation
Highest reported total ISR routine time (%): 0,021689
Driver with highest ISR total time: Wdf01000.sys - Kernel Mode Driver Framework Runtime, Microsoft Corporation
Total time spent in ISRs (%) 0,022837
ISR count (execution time <250 µs): 71369
ISR count (execution time 250-500 µs): 0
ISR count (execution time 500-1000 µs): 95
ISR count (execution time 1000-2000 µs): 1
ISR count (execution time 2000-4000 µs): 38
ISR count (execution time >=4000 µs): 0
_________________________________________________________________________________________________________
REPORTED DPCs
_________________________________________________________________________________________________________
DPC routines are part of the interrupt servicing dispatch mechanism and disable the possibility for a process to utilize the CPU while it is interrupted until the DPC has finished execution.
Highest DPC routine execution time (µs): 102052,851032
Driver with highest DPC routine execution time: Wdf01000.sys - Kernel Mode Driver Framework Runtime, Microsoft Corporation
Highest reported total DPC routine time (%): 0,018477
Driver with highest DPC total execution time: Wdf01000.sys - Kernel Mode Driver Framework Runtime, Microsoft Corporation
Total time spent in DPCs (%) 0,056614
DPC count (execution time <250 µs): 581168
DPC count (execution time 250-500 µs): 0
DPC count (execution time 500-10000 µs): 584
DPC count (execution time 1000-2000 µs): 2
DPC count (execution time 2000-4000 µs): 123
DPC count (execution time >=4000 µs): 86
_________________________________________________________________________________________________________
REPORTED HARD PAGEFAULTS
_________________________________________________________________________________________________________
Hard pagefaults are events that get triggered by making use of virtual memory that is not resident in RAM but backed by a memory mapped file on disk. The process of resolving the hard pagefault requires reading in the memory from disk while the process is interrupted and blocked from execution.
NOTE: some processes were hit by hard pagefaults. If these were programs producing audio, they are likely to interrupt the audio stream resulting in dropouts, clicks and pops. Check the Processes tab to see which programs were hit.
Process with highest pagefault count: msmpeng.exe
Total number of hard pagefaults 539
Hard pagefault count of hardest hit process: 201
Number of processes hit: 22
_________________________________________________________________________________________________________
PER CPU DATA
_________________________________________________________________________________________________________
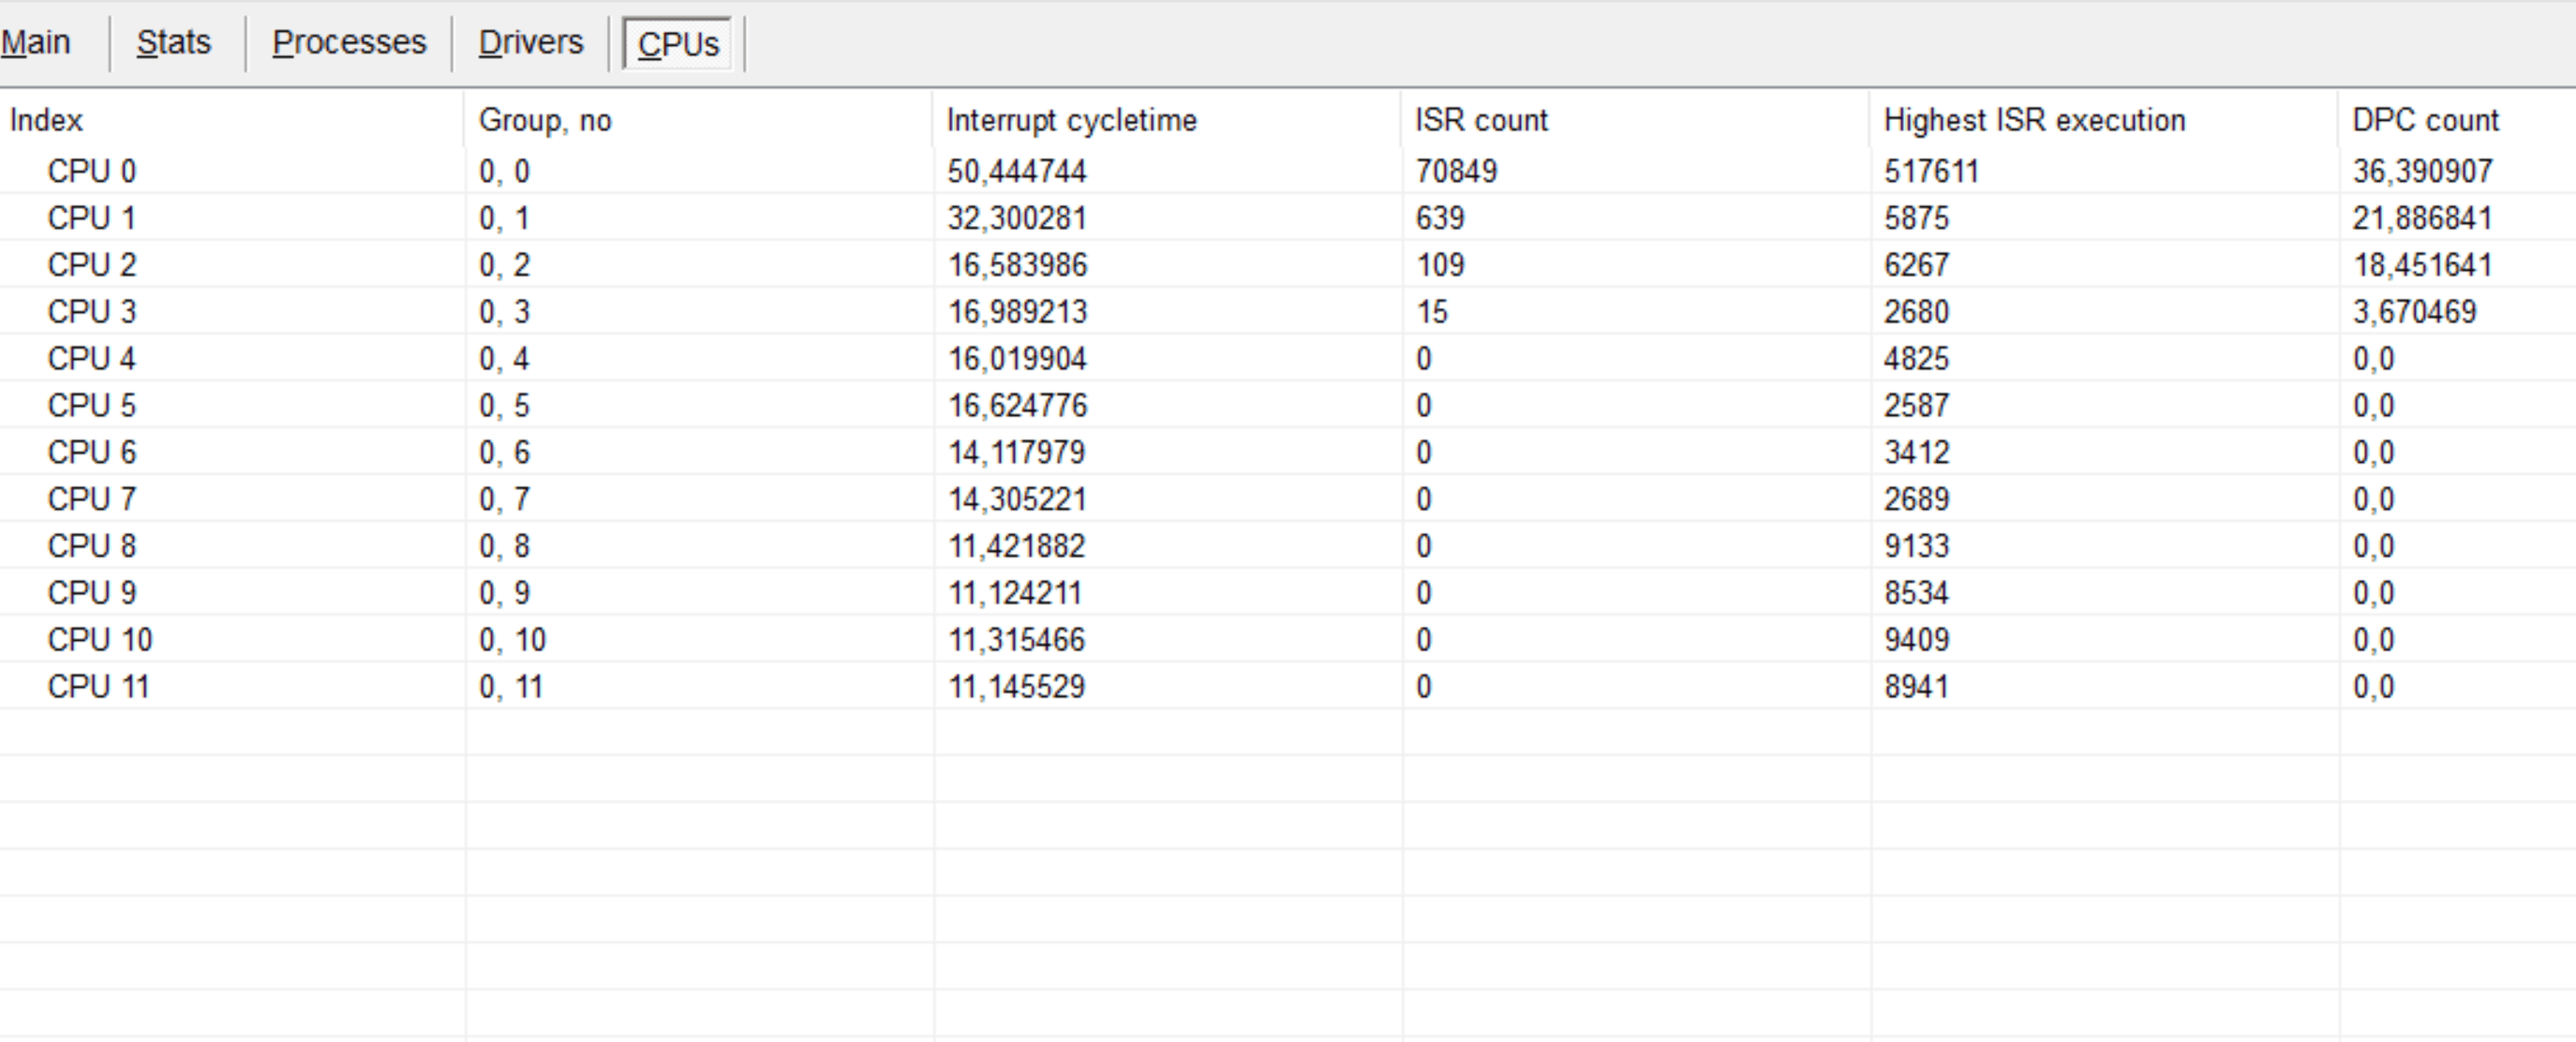
CPU 0 Interrupt cycle time (s): 50,444744
CPU 0 ISR highest execution time (µs): 36390,907448
CPU 0 ISR total execution time (s): 3,061482
CPU 0 ISR count: 70849
CPU 0 DPC highest execution time (µs): 102052,851032
CPU 0 DPC total execution time (s): 7,376455
CPU 0 DPC count: 517611
_________________________________________________________________________________________________________
CPU 1 Interrupt cycle time (s): 32,300282
CPU 1 ISR highest execution time (µs): 21886,840708
CPU 1 ISR total execution time (s): 0,278418
CPU 1 ISR count: 639
CPU 1 DPC highest execution time (µs): 49506,825959
CPU 1 DPC total execution time (s): 0,443205
CPU 1 DPC count: 5875
_________________________________________________________________________________________________________
CPU 2 Interrupt cycle time (s): 16,583987
CPU 2 ISR highest execution time (µs): 18451,641224
CPU 2 ISR total execution time (s): 0,109555
CPU 2 ISR count: 109
CPU 2 DPC highest execution time (µs): 21873,700221
CPU 2 DPC total execution time (s): 0,115272
CPU 2 DPC count: 6267
_________________________________________________________________________________________________________
CPU 3 Interrupt cycle time (s): 16,989213
CPU 3 ISR highest execution time (µs): 3670,468658
CPU 3 ISR total execution time (s): 0,003888
CPU 3 ISR count: 15
CPU 3 DPC highest execution time (µs): 127,276549
CPU 3 DPC total execution time (s): 0,019085
CPU 3 DPC count: 2680
_________________________________________________________________________________________________________
CPU 4 Interrupt cycle time (s): 16,019904
CPU 4 ISR highest execution time (µs): 0,0
CPU 4 ISR total execution time (s): 0,0
CPU 4 ISR count: 0
CPU 4 DPC highest execution time (µs): 3668,488569
CPU 4 DPC total execution time (s): 0,045217
CPU 4 DPC count: 4825
_________________________________________________________________________________________________________
CPU 5 Interrupt cycle time (s): 16,624777
CPU 5 ISR highest execution time (µs): 0,0
CPU 5 ISR total execution time (s): 0,0
CPU 5 ISR count: 0
CPU 5 DPC highest execution time (µs): 11331,094395
CPU 5 DPC total execution time (s): 0,031013
CPU 5 DPC count: 2587
_________________________________________________________________________________________________________
CPU 6 Interrupt cycle time (s): 14,117979
CPU 6 ISR highest execution time (µs): 0,0
CPU 6 ISR total execution time (s): 0,0
CPU 6 ISR count: 0
CPU 6 DPC highest execution time (µs): 11013,078909
CPU 6 DPC total execution time (s): 0,040209
CPU 6 DPC count: 3412
_________________________________________________________________________________________________________
CPU 7 Interrupt cycle time (s): 14,305222
CPU 7 ISR highest execution time (µs): 0,0
CPU 7 ISR total execution time (s): 0,0
CPU 7 ISR count: 0
CPU 7 DPC highest execution time (µs): 288,482301
CPU 7 DPC total execution time (s): 0,021888
CPU 7 DPC count: 2689
_________________________________________________________________________________________________________
CPU 8 Interrupt cycle time (s): 11,421882
CPU 8 ISR highest execution time (µs): 0,0
CPU 8 ISR total execution time (s): 0,0
CPU 8 ISR count: 0
CPU 8 DPC highest execution time (µs): 7250,685103
CPU 8 DPC total execution time (s): 0,122371
CPU 8 DPC count: 9133
_________________________________________________________________________________________________________
CPU 9 Interrupt cycle time (s): 11,124212
CPU 9 ISR highest execution time (µs): 0,0
CPU 9 ISR total execution time (s): 0,0
CPU 9 ISR count: 0
CPU 9 DPC highest execution time (µs): 3674,196534
CPU 9 DPC total execution time (s): 0,105582
CPU 9 DPC count: 8534
_________________________________________________________________________________________________________
CPU 10 Interrupt cycle time (s): 11,315467
CPU 10 ISR highest execution time (µs): 0,0
CPU 10 ISR total execution time (s): 0,0
CPU 10 ISR count: 0
CPU 10 DPC highest execution time (µs): 7579,325221
CPU 10 DPC total execution time (s): 0,125202
CPU 10 DPC count: 9409
_________________________________________________________________________________________________________
CPU 11 Interrupt cycle time (s): 11,145529
CPU 11 ISR highest execution time (µs): 0,0
CPU 11 ISR total execution time (s): 0,0
CPU 11 ISR count: 0
CPU 11 DPC highest execution time (µs): 487,712021
CPU 11 DPC total execution time (s): 0,115496
CPU 11 DPC count: 8941
_________________________________________________________________________________________________________
Moderator note < added words , rearranged for clarity >
' cx='32' cy='32' r='32' /%3E%3Ctext x='50%25' y='55%25' dominant-baseline='middle' text-anchor='middle' fill='%23FFF' %3EA%3C/text%3E%3C/svg%3E)