Microsoft 365 and Office | SharePoint | For business | Windows
A group of Microsoft Products and technologies used for sharing and managing content, knowledge, and applications.
This browser is no longer supported.
Upgrade to Microsoft Edge to take advantage of the latest features, security updates, and technical support.
' cx='32' cy='32' r='32' /%3E%3Ctext x='50%25' y='55%25' dominant-baseline='middle' text-anchor='middle' fill='%23FFF' %3EAF%3C/text%3E%3C/svg%3E)
I am tasked with creating some data visualizations that pulls its live data from a SharePoint online list. The only way I can think to do it is to export the list data and save the file in the same SharePoint site in a library, making a connection between the Excel file and the SP list. Then, in the Excel file use pivot tables, charts, etc., then use a webpart on a SharePoint page to shows these tables/charts (not sure how to do that yet, but first things first).
I have two charts I'm trying to make first:
Can anyone guide me on this? Am I going about this the wrong way? Is there an easier approach (short of purchasing MS BI which I don't have the money to do). Even pointing me to good online resources would be helpful. I'm inexperienced at this and sometimes it's difficult to get good results when you don't know how to formulate the Google query.
A group of Microsoft Products and technologies used for sharing and managing content, knowledge, and applications.
A family of Microsoft spreadsheet software with tools for analyzing, charting, and communicating data
' cx='32' cy='32' r='32' /%3E%3Ctext x='50%25' y='55%25' dominant-baseline='middle' text-anchor='middle' fill='%23FFF' %3EMM%3C/text%3E%3C/svg%3E)
Hi @Angela French ,
Is there anything update on your issue? Please remember to mark my reply as accepted answer if it helps you.
Hi @Angela French ,
For your second question, you could create a new table and use the cell caculation to get the count. Below is my sample:
< 30: =COUNTIF(C:C,">"&TODAY()-30)
30-59: =COUNTIFS(C:C,"<"&(TODAY()-30),C:C,">"&(TODAY()-59))
And> 60: =COUNTIF(C:C,"<"&TODAY()-60)
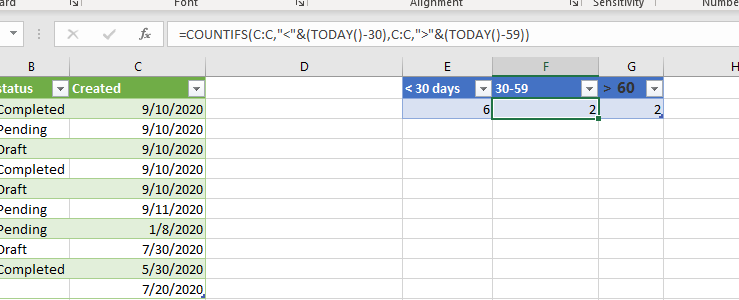
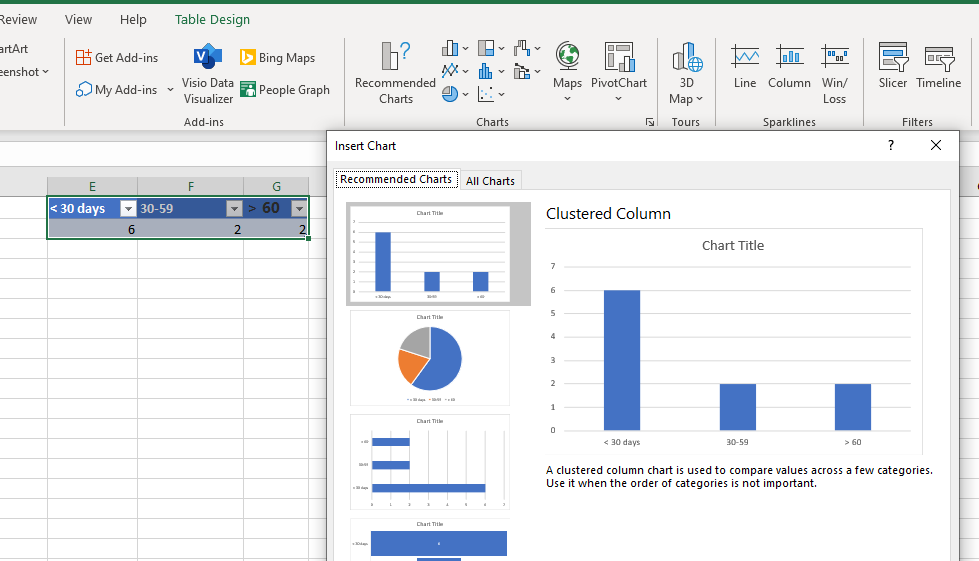
After creating the table, you could create the chart based on it.
If an Answer is helpful, please click "Accept Answer" and upvote it.
Note: Please follow the steps in our documentation to enable e-mail notifications if you want to receive the related email notification for this thread.
Hi @Angela French ,
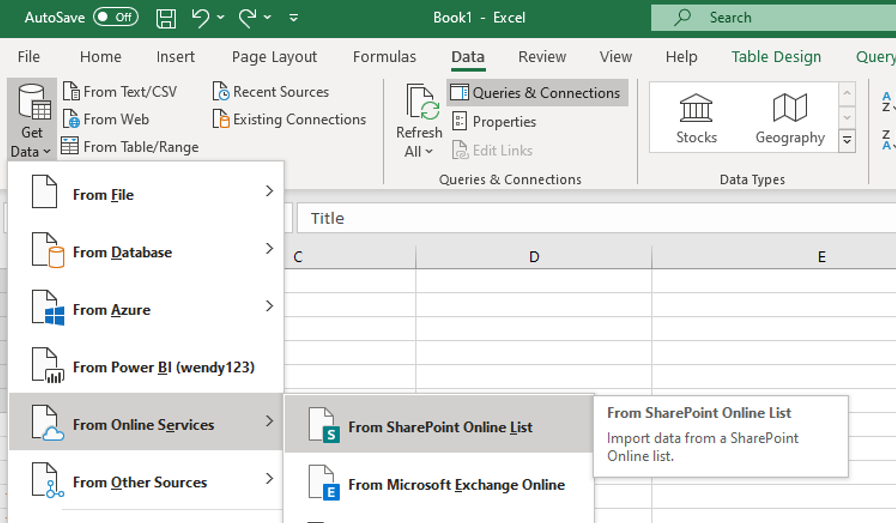
In the excel, you could get the data from SharePoint online list to build the connection. Like the below picture shows:
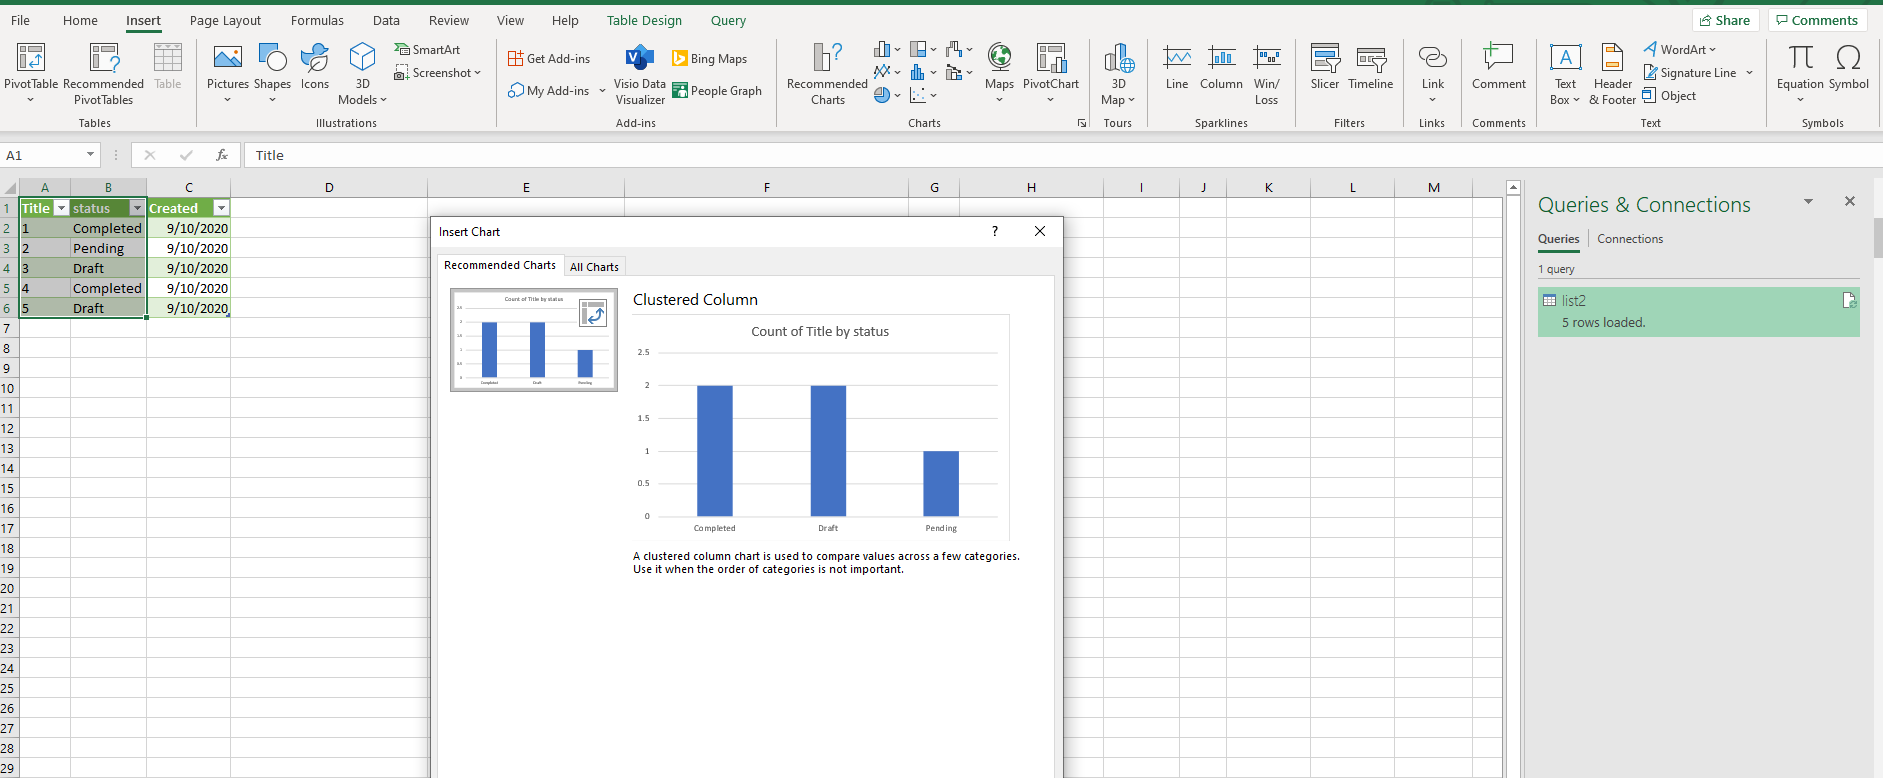
And when you get the data from the list, you could create chart based on the data:
If an Answer is helpful, please click "Accept Answer" and upvote it.
Note: Please follow the steps in our documentation to enable e-mail notifications if you want to receive the related email notification for this thread.
Thanks. That is a more direct route than the exporting I guess, but achieves the same thing. Would you happen to have any suggestions for part 2 of my question?
' cx='32' cy='32' r='32' /%3E%3Ctext x='50%25' y='55%25' dominant-baseline='middle' text-anchor='middle' fill='%23FFF' %3EAF%3C/text%3E%3C/svg%3E)
I appreciate all the tips. I have been able to put the charts back onto a page on our SharePoint site. However, the charts are not automatically updating when the list is updated as I had though it would. It updates if I go back to the Excel file and update the data but the whole point of doing this was for it to be a live data visualization. Am I missing something?