Developer technologies | Windows Presentation Foundation
A part of the .NET Framework that provides a unified programming model for building line-of-business desktop applications on Windows.
This browser is no longer supported.
Upgrade to Microsoft Edge to take advantage of the latest features, security updates, and technical support.
' cx='32' cy='32' r='32' /%3E%3Ctext x='50%25' y='55%25' dominant-baseline='middle' text-anchor='middle' fill='%23FFF' %3ECH%3C/text%3E%3C/svg%3E)
Source thread: Generating a graph using DataVisualization Charting in WPF, answered by Peter Fleischer.
I have a chart here:
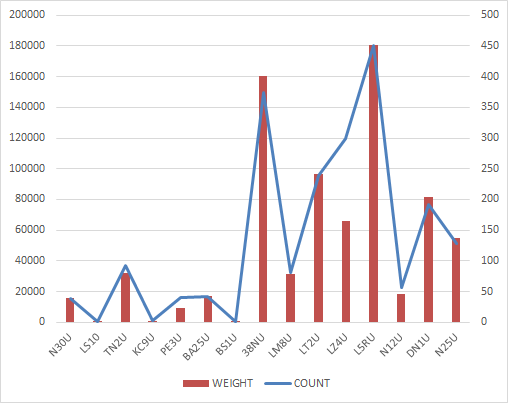
I want to get the same chart drawn with System.Windows.Controls.DataVisualization.Toolkit in WPF app, does anyone know how to do it?

Hi,
Welcome to our Microsoft Q&A platform!
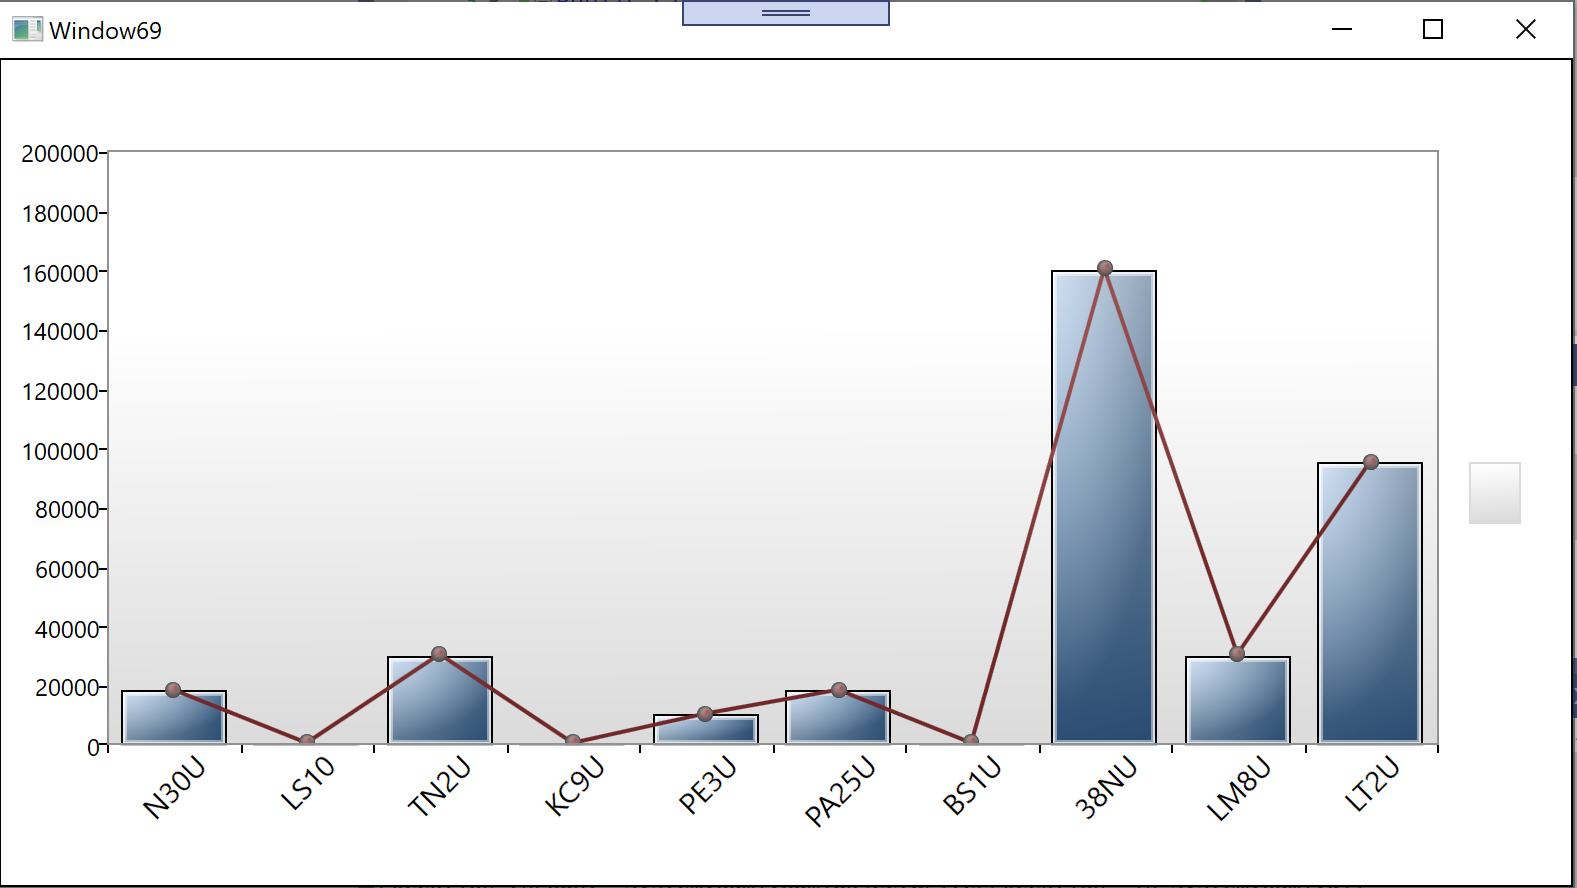
start with this demo:
Xaml:
<Window x:Class="Window69"
        xmlns="http://schemas.microsoft.com/winfx/2006/xaml/presentation"
        xmlns:x="http://schemas.microsoft.com/winfx/2006/xaml"
        xmlns:d="http://schemas.microsoft.com/expression/blend/2008"
        xmlns:mc="http://schemas.openxmlformats.org/markup-compatibility/2006"
        xmlns:local="clr-namespace:WpfApp1"
        xmlns:dvc="clr-namespace:System.Windows.Controls.DataVisualization.Charting;assembly=System.Windows.Controls.DataVisualization.Toolkit"
        mc:Ignorable="d"
        Title="Window69" Height="450" Width="800">
  <Window.DataContext>
    <local:Window69VM/>
  </Window.DataContext>
  <Grid x:Name="grd">
    <dvc:Chart>
      <dvc:Chart.Axes>
        <dvc:CategoryAxis Orientation="X">
          <dvc:CategoryAxis.AxisLabelStyle>
            <Style x:Name="labelStyleX1" TargetType="Control">
              <Setter Property="FontSize" Value="15"/>
              <Setter Property="LayoutTransform" >
                <Setter.Value>
                  <RotateTransform  Angle="-45" />
                </Setter.Value>
              </Setter>
              <Setter Property="Foreground" Value="Black"/>
            </Style>
          </dvc:CategoryAxis.AxisLabelStyle>
        </dvc:CategoryAxis>
      </dvc:Chart.Axes>
      <dvc:Chart.Series>
        <dvc:ColumnSeries ItemsSource="{Binding Line1}"
                          DependentValuePath="Value"
                          IndependentValuePath="Col">
          <dvc:ColumnSeries.LegendItemStyle >
            <Style TargetType="dvc:LegendItem">
              <Setter Property="Visibility" Value="Collapsed"/>
            </Style>
          </dvc:ColumnSeries.LegendItemStyle>
          <dvc:ColumnSeries.DependentRangeAxis>
            <dvc:LinearAxis Minimum="0" Maximum="200000" Orientation="Y"/>
          </dvc:ColumnSeries.DependentRangeAxis>
        </dvc:ColumnSeries>
        <dvc:LineSeries ItemsSource="{Binding Line1}"
                          DependentValuePath="Value"
                          IndependentValuePath="Col">
          <dvc:LineSeries.LegendItemStyle >
            <Style TargetType="dvc:LegendItem">
              <Setter Property="Visibility" Value="Collapsed"/>
            </Style>
          </dvc:LineSeries.LegendItemStyle>
        </dvc:LineSeries>
      </dvc:Chart.Series>
    </dvc:Chart>
  </Grid>
</Window>
And classes:
Public Class Window69VM
  Public Sub New()
    Line1.Add(New Data With {.Col = "N30U", .Value = 18000})
    Line1.Add(New Data With {.Col = "LS10", .Value = 100})
    Line1.Add(New Data With {.Col = "TN2U", .Value = 30000})
    Line1.Add(New Data With {.Col = "KC9U", .Value = 100})
    Line1.Add(New Data With {.Col = "PE3U", .Value = 10000})
    Line1.Add(New Data With {.Col = "PA25U", .Value = 18000})
    Line1.Add(New Data With {.Col = "BS1U", .Value = 100})
    Line1.Add(New Data With {.Col = "38NU", .Value = 160000})
    Line1.Add(New Data With {.Col = "LM8U", .Value = 30000})
    Line1.Add(New Data With {.Col = "LT2U", .Value = 95000})
  End Sub
  Public Property Line1 As New List(Of Data)
  Public Class Data
    Public Property Value As Integer
    Public Property Col As String
  End Class
End Class
Thanks.
' cx='32' cy='32' r='32' /%3E%3Ctext x='50%25' y='55%25' dominant-baseline='middle' text-anchor='middle' fill='%23FFF' %3EA%3C/text%3E%3C/svg%3E)
System.Windows.Controls.DataVisualization.Toolkit has been deprecated, what do we use now?
' cx='32' cy='32' r='32' /%3E%3Ctext x='50%25' y='55%25' dominant-baseline='middle' text-anchor='middle' fill='%23FFF' %3ECG%3C/text%3E%3C/svg%3E)
Hi!
I cannot reference this:
xmlns:dvc="clr-namespace:System.Windows.Controls.DataVisualization.Charting;assembly=System.Windows.Controls.DataVisualization.Toolkit"
What project reference should I include please?

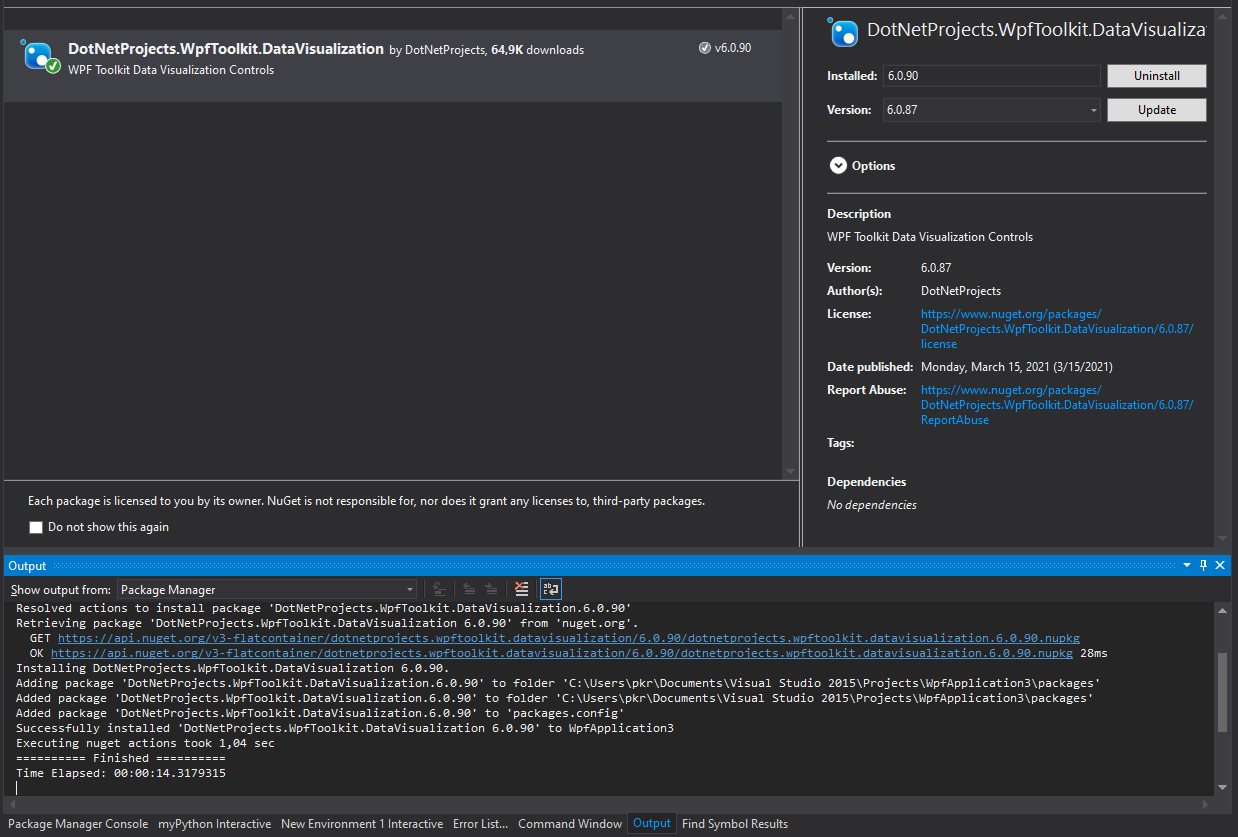
In the Window-tag for the xaml:
xmlns:chartingToolkit="clr-namespace:System.Windows.Controls.DataVisualization.Charting;assembly=DotNetProjects.DataVisualization.Toolkit"
Based on: https://www.codeproject.com/Articles/196502/WPF-Toolkit-Charting-Controls-Line-Bar-Area-Pie-Co