Ethernet throughput keeps randomly dropping to 0 every few seconds.

Quake 31 Reputation points
2022-09-29T08:47:56.943+00:00

@Gary Nebbett help me out please. Ethernet throughput keeps droping to 0 every few seconds but my internet works perfectly fine for every other computer without any drops. I even changed the cable and it still randomly drops to 0 all browsers are extremely slow and videos take forever to load.245925-ether.jpg

Windows for business | Windows Client for IT Pros | Networking | Network connectivity and file sharing
{count} votes

Accepted answer
  1. Gary Nebbett 6,216 Reputation points
    2022-10-05T08:06:39.847+00:00

    Hello Quake,

    With IPv6 enabled, could you try changing one of those advanced properties (TCPChecksumOffloadIPv6) from its default value of "Rx & Tx Enabled" to "Tx Enabled"?

    247639-image.png

    There is an Intel technical note that might be relevant to your problem: Disabling TCP-IPv6 Checksum Offload Capability with Intel® 1/10 GbE Controllers. The key content of that note is:

    In some situations where a client machine is connected via some specific Optical Network Terminals (ONTs), and data is appended after the packet checksum, the network adapter can drop receive packets when using TCP-IPv6 Checksum Offload for receive traffic.

    If a test with that setting shows reasonable performance, then just let us know that (no need for a new trace).

    Gary

    2 people found this answer helpful.

4 additional answers

Sort by: Most helpful
  1. Limitless Technology 44,751 Reputation points
    2022-09-30T08:58:48.227+00:00

    Hello there,

    My guess is that something is interfering with the dispatching of the NDIS IoWorkItem.

    In both the transmit (upload) and receive (download) sections of the trace data, data transfer stops because no received packets are being reported to the TCP/IP stack. The transmit (upload) transfer stops when the receive or congestion windows are fully used up (since no acknowledgements are received, the available space in the windows fall to zero).

    The below thread discusses the same issue and you can try out some troubleshooting steps from this and see if that helps you to sort the Issue.
    https://answers.microsoft.com/en-us/windows/forum/all/ethernet-connetion-to-my-desktop-keeps-dropping/1d9d08ff-7675-4b0f-937d-4cb897f0eb8d

    https://learn.microsoft.com/en-us/answers/questions/676275/network-throughput-drops-to-0kbps-send-and-recieve.html

    -------------------------------------------------------------------------------------------------------------------------------------------------

    --If the reply is helpful, please Upvote and Accept it as an answer--

    0 comments No comments

  2. Gary Nebbett 6,216 Reputation points
    2022-10-02T09:49:14.647+00:00

    Hello Quake,

    Removal of the Malwarebytes software has made the ETW traces easier to interpret, but I still can't find any obvious problem(s) in the data. What follows is my current suggestion.

    246686-image.png

    Most browsers have a "developer tools" feature that can show network actions (like that shown above). In the Protocol column of that image, I have highlighted 3 values to partially explain why it is difficult to relate descriptions of human perceptions of browser performance to network traffic. Data can be exchanged via 3 different protocols: HTTP/1.1 (one or more HTTP requests, in sequence, over a TCP connection), HTTP/2 (multiple, interleaved, requests over a TCP connection) or HTTP/3 (multiple, interleaved, requests over a QUIC/UDP connection).

    My proposal is:

    • Start the pktmon trace, as before.
    • Open the "DevTools" feature for a browser tab and make sure that network traffic is being recorded (and that script exceptions don't pause in the script debugger).
    • In that tab, browser until a clear example of the problem occurs.
    • Immediately that a problem occurs, stop and save the DevTools network recording (this should create a .har file)
    • Stop the pktmon trace.
    • Make both the pktmon why.etl and the browser .har file available

    Even with this approach, it might be difficult to identify problem requests and correlate the two trace files, but I think that it is worth a try.

    Gary


  3. Gary Nebbett 6,216 Reputation points
    2022-10-03T15:43:50.957+00:00

    Hello Quake,

    Correlating the trace data from the two files turned out to be quite difficult (a combination of TLS encryption and often "meaningless" IPv4/IPv6 addresses (of Content Delivery Network (CDN) servers whose reverse looked-up name is either not available or not easily linked to a URL name; for example: lga15s49-in-x01.1e100.net (a Google server)).

    When I just looked for any "odd" behaviour, I did find something that needs more investigation and might be related to the behaviour that you observe. Here is one view of what is happening:

    247103-image.png

    After some successful data exchange, the client (browser) system seems to not recognize (and not act upon) a received acknowledgment; when Wireshark calculates the TCP checksum, it finds it to be correct.

    The view from the TCP/IP stack is:

    247079-image.png

    The driver decides that the checksum is incorrect! Either the packet data has been modified after arrival or there is some confusion about offloading the checksum verification.

    There is more work to do to understand what might be happening - I just wanted to let you know that there is a glimmer of hope for an improvement in the situation.

    Gary


  4. Gary Nebbett 6,216 Reputation points
    2022-10-04T08:25:56.163+00:00

    Hello Quake,

    We are a lot closer to understanding this problem - which seems to affect both TCP and UDP traffic over IPv6.

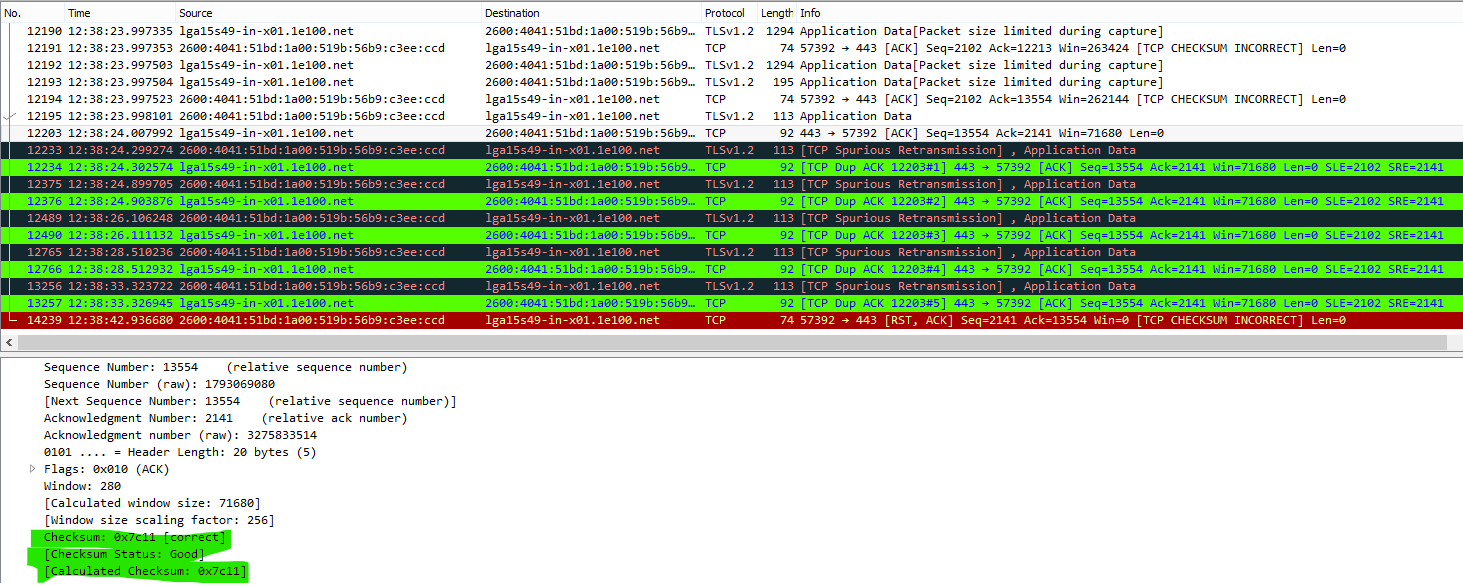
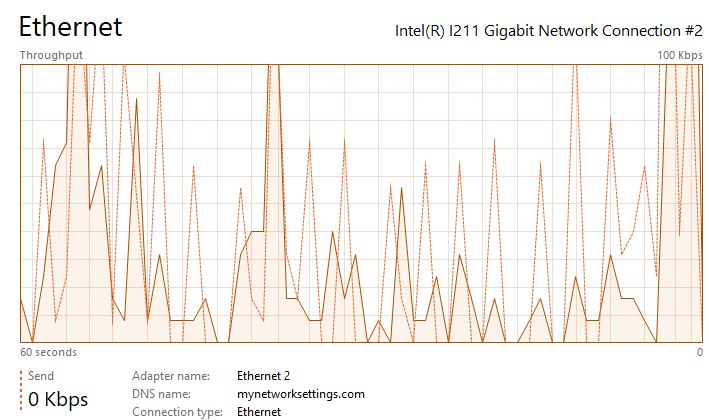
    For a TCP connection, the first two data link frames received from the remote system typically have lengths of 86 and 74 bytes - these sizes correspond to the size of the network layer content. All subsequently received data link frames on the connection have a size of at least 92 bytes - even if their network layer content is smaller.

    If the data link frame has a size of 92 or 93 bytes, a checksum error is always reported and the frame is dropped/discarded.

    Sometimes, after a while, the remote system might have enough data to send such that the resulting data link frame is 94 or more bytes in size - this passes the checksum test and (temporarily) unblocks the stalled connection.

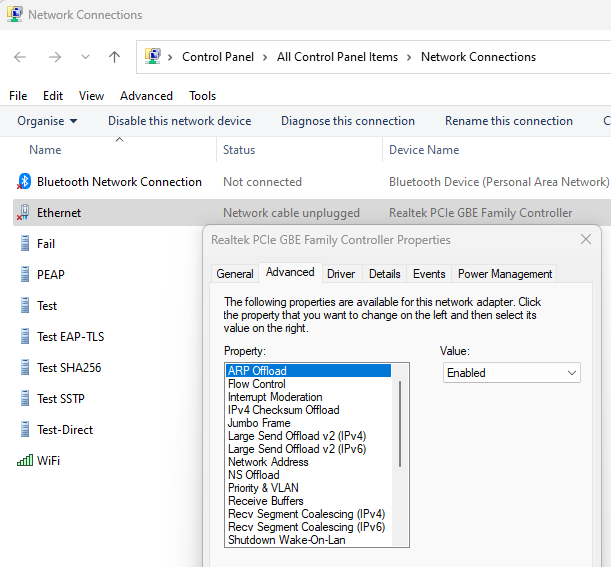
    My current guess is that the Intel I211 Gigabit Network driver is responsible for this problem - the network adapter is a complicated device that understands network and transport layer protocols and can fragment and coalesce data.

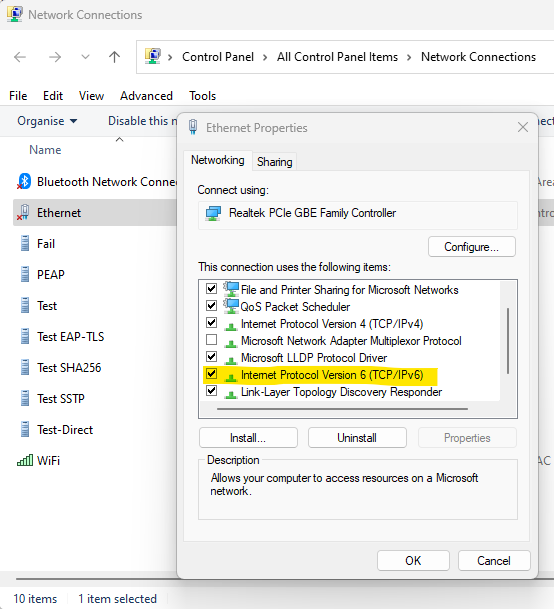
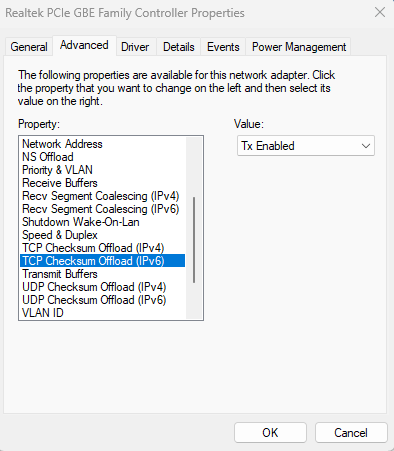
    Have you changed any of the "Advanced Properties" of the adapter?

    247286-image.png

    Could you issue the command reg export HKEY_LOCAL_MACHINE\SYSTEM\ControlSet001\Control\Class\{4d36e972-e325-11ce-bfc1-08002be10318} why.txt and make the file why.txt available? This file will contain the advanced properties of all network adapters on the system.

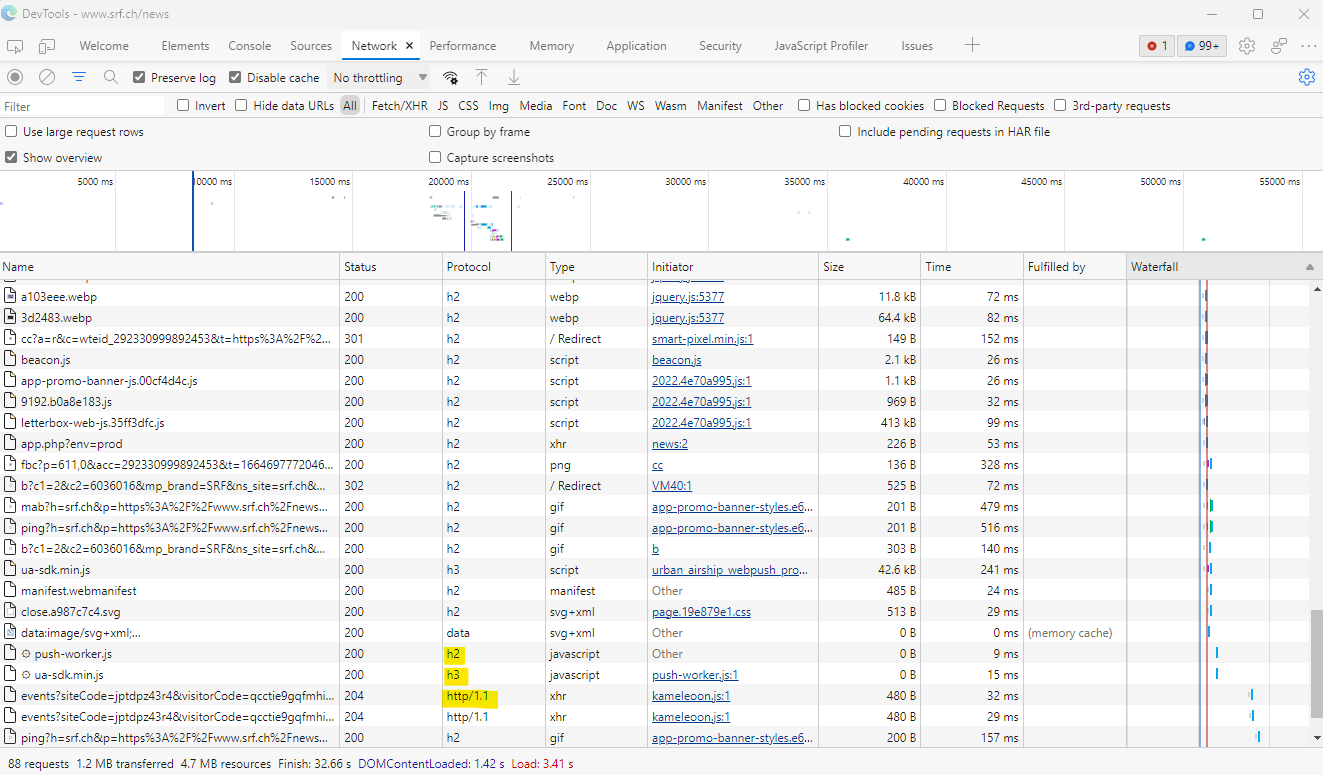
    Another thing that might be useful/interesting would be a new trace (with a slightly modified command) with IPv6 re-enabled. The new command is pktmon start --capture --comp all --flags 0x1F --trace --provider Microsoft-Windows-TCPIP --keywords 0x200700000000 --level 16 --file-name why.etl

    The only differences in the commands is that "nics" has been replaced by "all" in order to capture packets at multiple points in their processing and the flags have been changed from their default of 0x12 to 0x1F.

    Gary


Your answer

Answers can be marked as Accepted Answers by the question author, which helps users to know the answer solved the author's problem.