Azure Monitor
An Azure service that is used to collect, analyze, and act on telemetry data from Azure and on-premises environments.
3,037 questions
This browser is no longer supported.
Upgrade to Microsoft Edge to take advantage of the latest features, security updates, and technical support.
' cx='32' cy='32' r='32' /%3E%3Ctext x='50%25' y='55%25' dominant-baseline='middle' text-anchor='middle' fill='%23FFF' %3EM%3C/text%3E%3C/svg%3E)
Hi,
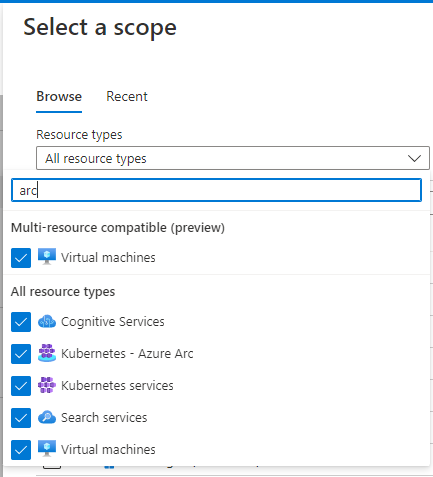
I wanted to add a number of Arc servers to dashboard and show some basic metrics like CPU and mem usage to a graph (single graph for CPUs and single for mem). I can add graph from each individual Arc server by simply pinning existing CPU graph from Arc Insight to my dashboard, but that would give me multiple separate graphs, which is not what I want. When I start a fresh graph on dashboard and want to select a scope to be Arc servers, I cannot see it. I can select "Virtual Machines" scope but that will give me Azure VM's only, not Arc servers. Is there a way to select Arc server as a resource type?

Hi there,
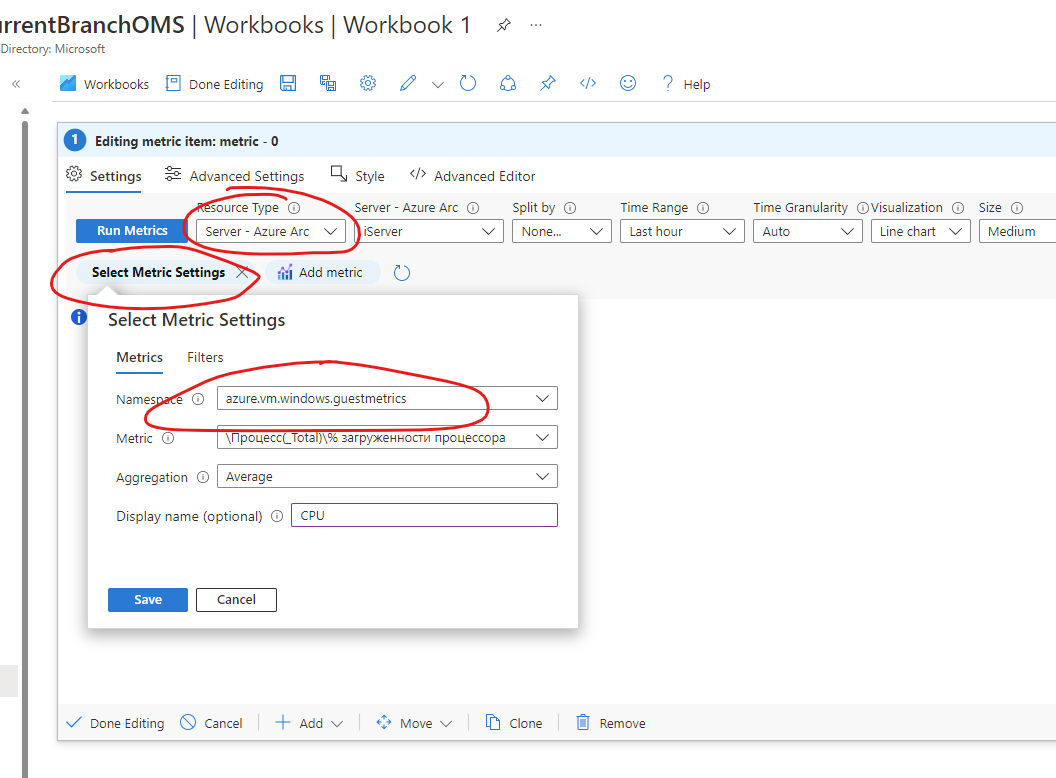
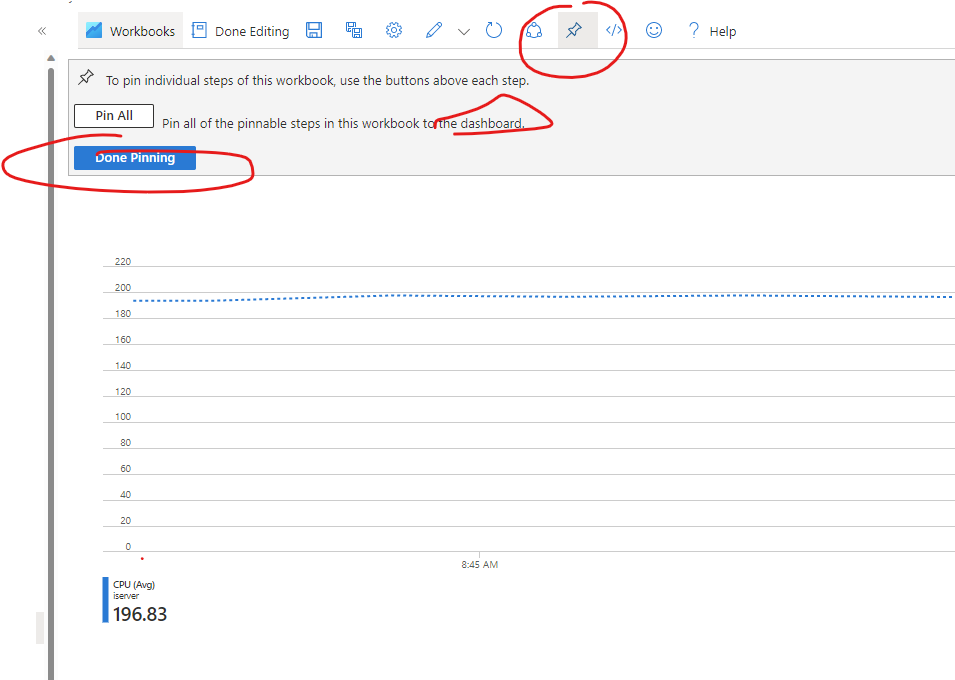
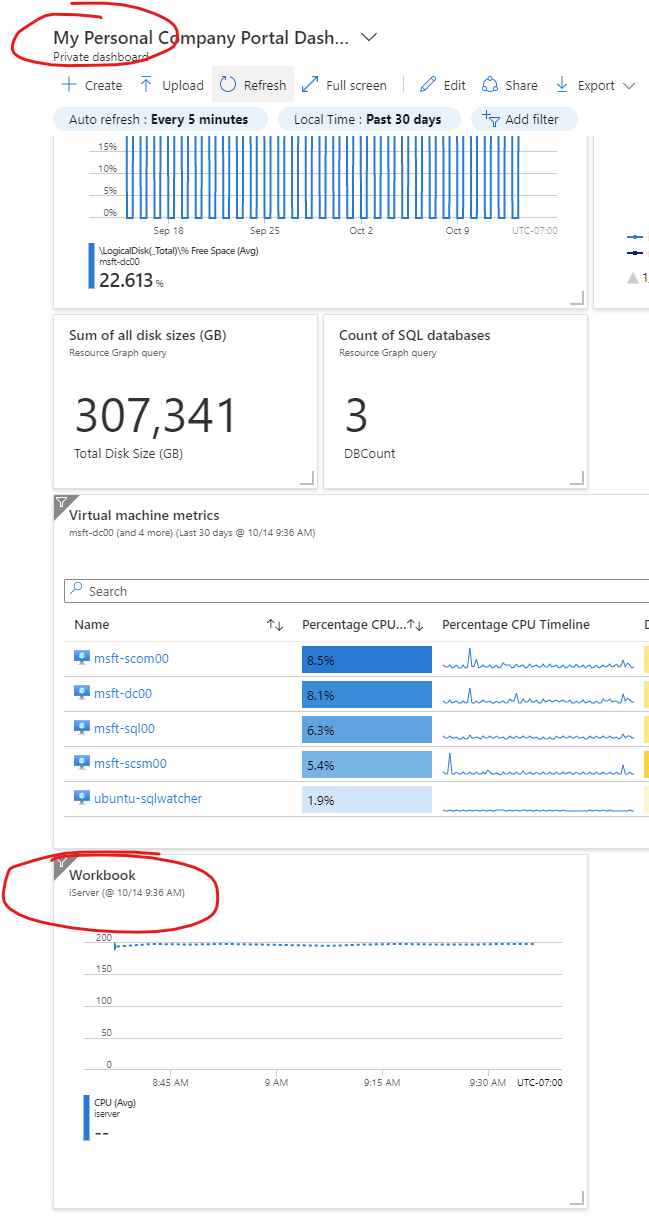
Currently, the Arc-based metrics are not supported in Azure Dashboards directly. But as a workaround you can create a workbook with the Arc-based metrics and pin the tile of the workbook to your dashboard

What would it be I do not see the metrics for azure arc machines, only for azure vms. I already created the DCR for the Arc machines...
Does someone has an idea?
Tks