Azure Cloud Services
An Azure platform as a service offer that is used to deploy web and cloud applications.
677 questions
This browser is no longer supported.
Upgrade to Microsoft Edge to take advantage of the latest features, security updates, and technical support.

@AzureSupport, got two queries.
Awaiting for the response, kindly do share the details to my email id: ************************
Sainath Krishna
' cx='32' cy='32' r='32' /%3E%3Ctext x='50%25' y='55%25' dominant-baseline='middle' text-anchor='middle' fill='%23FFF' %3EKM%3C/text%3E%3C/svg%3E)
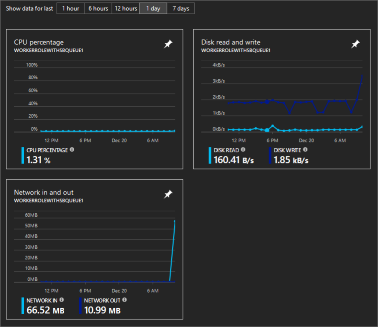
anonymous user Yes, you can monitor key performance metrics for any cloud service. A cloud service automatically collects basic monitoring data from the host virtual machine. This data includes CPU percentage, network in/out, and disk read/write. The collected monitoring data is automatically displayed on the overview and metrics pages of the cloud service, in the Azure portal.
Using Azure Diagnostics Extension
If the cloud service has the Microsoft.Azure.Diagnostics extension applied to a role, that role can collect additional points of data. This article provides an introduction to Azure Diagnostics for Cloud Services.
With basic monitoring, performance counter data from role instances is sampled and collected at 3-minute intervals. This basic monitoring data is not stored in your storage account and has no additional cost associated with it.
This diagnostics extension can collect the following types of information:
Custom performance counters
Application logs
Windows event logs
.NET event source
IIS logs
Manifest based ETW
Crash dumps
Customer error logs
Using Application Insights
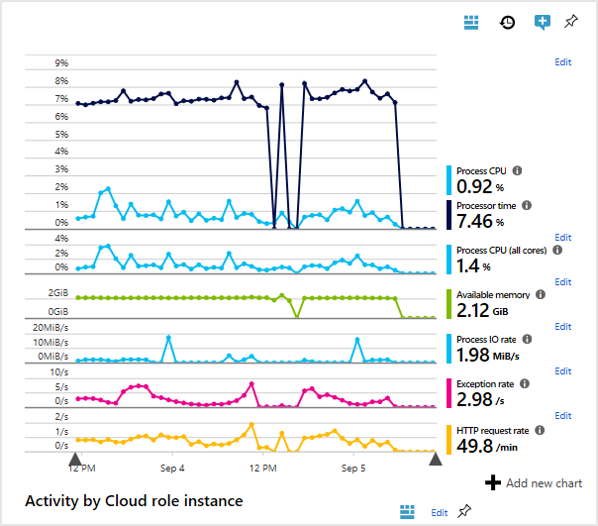
When you publish the Cloud Service from Visual Studio, you are given the option to send the diagnostic data to Application Insights. You can create the Application Insights Azure resource at that time or send the data to an existing Azure resource. Your cloud service can be monitored by Application Insights for availability, performance, failures, and usage. Custom charts can be added to Application Insights so that you can see the data that matters the most. Role instance data can be collected by using the Application Insights SDK in your cloud service project. For more information on how to integrate Application Insights, see Application Insights with Cloud Services.
The following counters are collected by default:
\Process(??APP_WIN32_PROC??)% Processor Time
\Memory\Available Bytes
.NET CLR Exceptions(??APP_CLR_PROC??)# of Exceps Thrown / sec
\Process(??APP_WIN32_PROC??)\Private Bytes
\Process(??APP_WIN32_PROC??)\IO Data Bytes/sec
\Processor(_Total)% Processor Time
For web roles, these counters are also collected:
\ASP.NET Applications(??APP_W3SVC_PROC??)\Requests/Sec
\ASP.NET Applications(??APP_W3SVC_PROC??)\Request Execution Time
\ASP.NET Applications(??APP_W3SVC_PROC??)\Requests In Application Queue
You can specify additional custom or other Windows performance counters by editing ApplicationInsights.config as shown in this example.
----------
Please don’t forget to "Accept the answer” and “up-vote” wherever the information provided helps you, this can be beneficial to other community members.