Cost Analysis by Pipeline level in ADF

Rohit Rajendra Sawane 96 Reputation points
2022-10-21T06:49:08.78+00:00

Hi team,
Currently I am researching the topic of Monitor costs at pipeline level with Cost Analysis.
Therefore I am referring this document "Plan to manage costs for Azure Data Factory".
As per document I have enable "by pipeline" option in data-factory as shown in the linked image. However, after enabling that option I am unable to view cost of each pipeline using the graphing tool of Cost Analysis as displayed in attached image. I also experimented with other filters to get the costs broken down by pipeline. The "Billing report" also does not provide a separate item for each pipeline.
Could you kindly provide me with images and instructions so that I can do cost analysis by pipeline level?

Thanks in advance!
252873-by-pipeline-option.jpeg252874-cost-analysis-by-graphing-tool.jpeg

Azure Data Factory
Azure Data Factory
An Azure service for ingesting, preparing, and transforming data at scale.
10,827 questions
0 comments No comments
{count} vote

Accepted answer
  1. ShaktiSingh-MSFT 15,421 Reputation points
    2022-10-22T13:01:44.06+00:00

    Hi @Anonymous ,

    I could now see the Pipeline Level Cost Details in the Cost Analysis(Preview) page:

    First Open Cost Analysis and then from the Right side open "Try Preview"
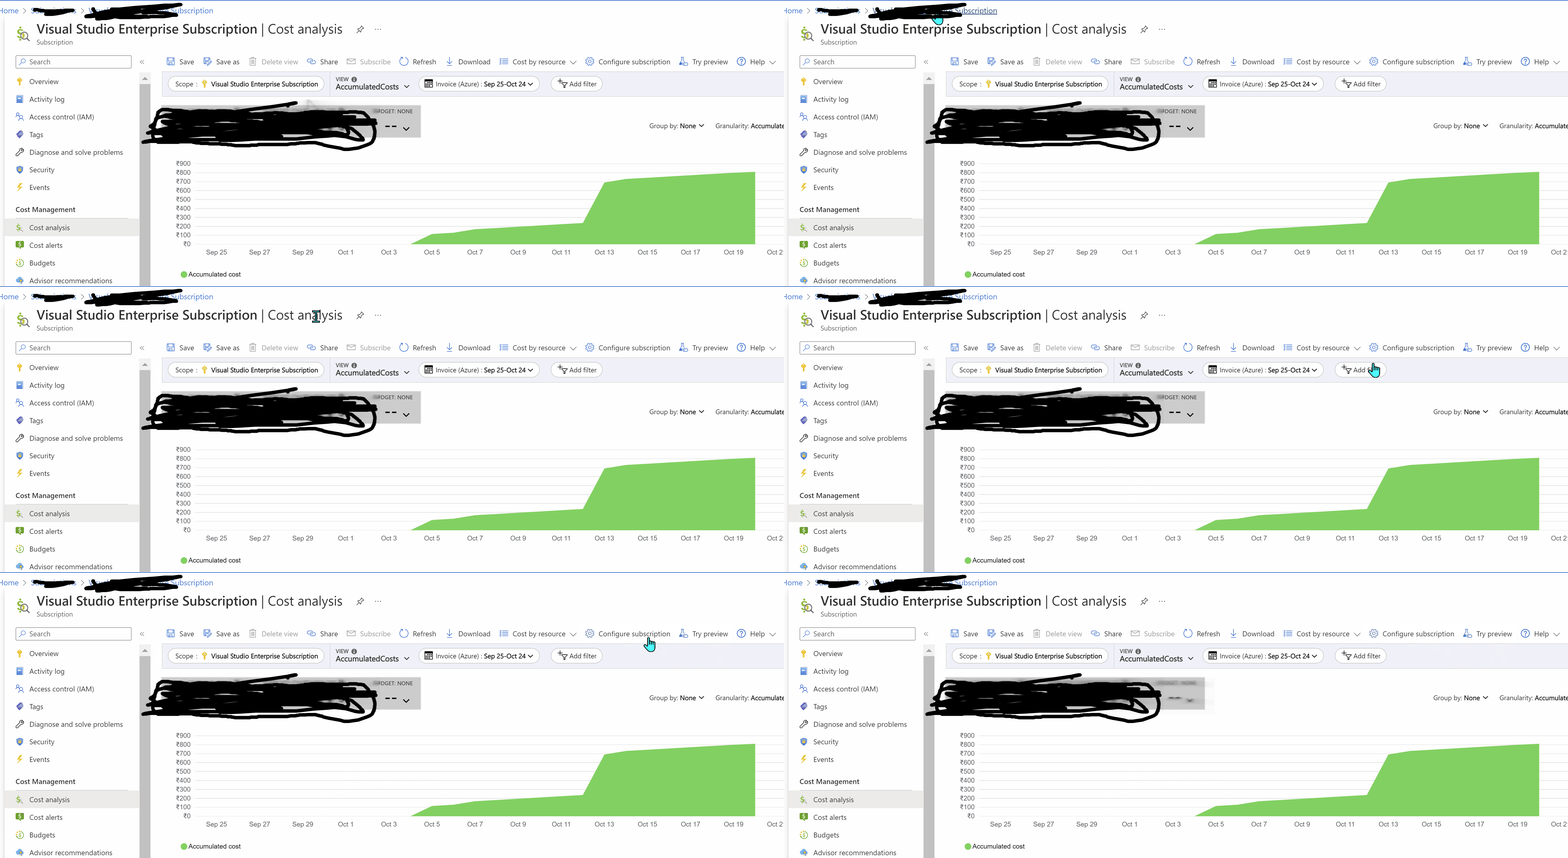
    253149-costapreview.gif

    Next, enable options of Cost Management Labs and then Reopen the page:

    253150-reopenpreview.gif

    After reopening, we could now see another icon Cost Analysis (Preview) above the existing Cost Analysis.
    Select Resources and search for the Data Factory in which you have enabled the Factory Settings to view Pipeline level details. You should see the details as shown in the below video:
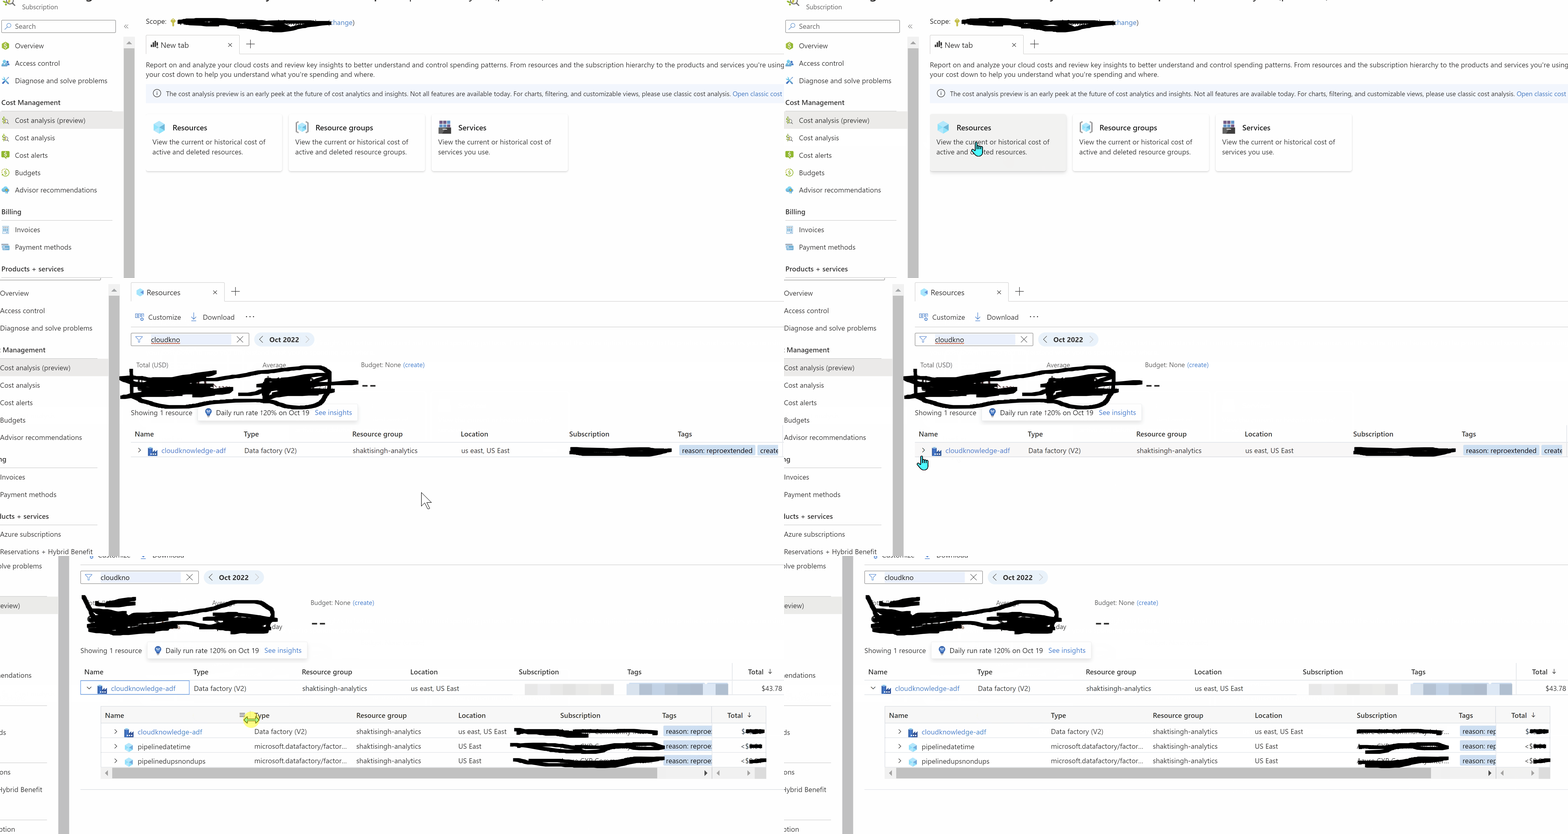
    253261-pipelinecostpreview.gif

    Refer to Granular Billing for Azure Data Factory to know the behavior and limitations of this newly added feature.

    Hope this will help. Please let us know if any further queries.

    ------------------------------

    • Please don't forget to click on 130616-image.png or upvote 130671-image.png button whenever the information provided helps you.
      Original posters help the community find answers faster by identifying the correct answer. Here is how
    • Want a reminder to come back and check responses? Here is how to subscribe to a notification
    2 people found this answer helpful.
    0 comments No comments

3 additional answers

Sort by: Most helpful
  1. ShaktiSingh-MSFT 15,421 Reputation points
    2022-10-21T10:49:30.947+00:00

    Hi @Anonymous ,

    Welcome to Microsoft Q&A platform and thanks for using Azure Services.

    Regarding your question about the new feature of Cost Analysis at Pipeline Level, I would suggest you wait for about 24 hours so that you would be able to see the Pipeline level cost in your report.

    Reference Link: Granular Billing for Azure Data Factory

    253006-image.png

    252993-image.png

    I have also enabled Factory Settings at Pipeline level and would update you once it shows up in Cost Analysis.

    Thanks for your patience.

    1 person found this answer helpful.

  2. Rohit Rajendra Sawane 96 Reputation points
    2022-10-22T18:20:27.353+00:00

    Hi @ShaktiSingh-MSFT

    Thank you for your answer. I am grateful for your support and explanation in very simple words. I have accepted the answer. Thanks a lot.

    Regards,

    Rohit S.

    0 comments No comments

  3. Rohit Rajendra Sawane 96 Reputation points
    2022-10-31T16:02:58.757+00:00

    Hi @ShaktiSingh-MSFT ,
    In addition to the previous answer,i.e. after publishing by pipeline option.
    "How to use a price calculator when there is dataflow (memory optimized)" is my main problem statement.
    Its explanation is that I ran the same pipeline four times which includes data flow (memory optimized).
    Using a price calculator and pipeline run consumption, I determined the total cost to be 104.36$. (image for price calculator).
    However, it does not match the amount shown on the "Cost Analysis (Preview)" (i.e., 96.07$).
    Cost for 4pipeline is separated into 2 rows on the cost analysis (preview) tab:
    the first row is for IR ($96.03), and the second row is for pipeline ($0.04).
    Consumptions for 4 pipelines are attached below.
    Would you kindly share a suggestion or a document on how to calculate costs when data flow (memory optimized) is involved?
    As if we use the same pipeline more than once, the cost analysis (preview) page does not display individual cost instead it is showing accumulated cost of all 4 pipeline together.

    Detail for Data flow runtime as below
    compute type= memory optimized
    core count= 32(+16 Drive Cores)
    Time to live = 30min.
    Please let me know if any further input required.

    255730-consumptions-for-4-run.jpg


Your answer

Answers can be marked as Accepted Answers by the question author, which helps users to know the answer solved the author's problem.