Developer technologies | C#
An object-oriented and type-safe programming language that has its roots in the C family of languages and includes support for component-oriented programming.
This browser is no longer supported.
Upgrade to Microsoft Edge to take advantage of the latest features, security updates, and technical support.
' cx='32' cy='32' r='32' /%3E%3Ctext x='50%25' y='55%25' dominant-baseline='middle' text-anchor='middle' fill='%23FFF' %3EAS%3C/text%3E%3C/svg%3E)
hi
Use the charts inside Visual Studio.
database ms access .
My problem now is if the years are not specified and repeated inside the years column.
And the sales column for each year gives more than one value within the year because the calculation is based on certain periods, months, or extended periods, and not on the basis of the year as a whole.
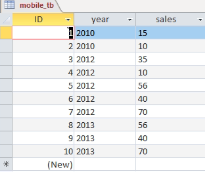
What I want is to create chart and dynamic Series,StackedColumn for the years that will not be repeated, as the years 2010-2012-2013
The addition of columns is appropriate for all sales within one year, where 2010 there are two sales, so they are visible in the column for the year 2010
. 2012 There are four sales that are displayed within the same column in a dynamic manner according to different sales
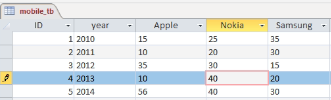
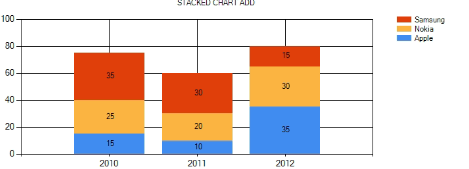
I designed this chart and it worked for me.
database
chart
code
  OleDbConnection conn = new OleDbConnection(ConfigurationManager.ConnectionStrings["Test"].ToString());
            conn.Open();
            string query = "SELECT * FROM mobile_tb ";
            OleDbCommand cmd = new OleDbCommand(query, conn);

            DataTable dt = new DataTable();
            dt.Load(cmd.ExecuteReader());
            conn.Close();


            if (dt != null && dt.Rows.Count > 0)
            {

                for (int i = 0; i < dt.Rows.Count; i++)
                {

                    chart1.Series["Apple"].Points.Add(new DataPoint(i, dt.Rows[i]["Apple"].ToString().Trim()));
                    chart1.Series["Nokia"].Points.Add(new DataPoint(i, dt.Rows[i]["Nokia"].ToString().Trim()));
                    chart1.Series["Samsung"].Points.Add(new DataPoint(i, dt.Rows[i]["Samsung"].ToString().Trim()));
                    chart1.Series[0].Points[i].AxisLabel = dt.Rows[i]["year"].ToString().Trim();

                }

            }
my
' cx='32' cy='32' r='32' /%3E%3Ctext x='50%25' y='55%25' dominant-baseline='middle' text-anchor='middle' fill='%23FFF' %3EA%3C/text%3E%3C/svg%3E)
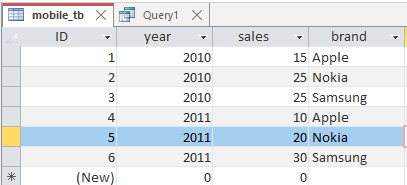
Based on your description, you want to pivot the table and show it on charts, you could Create PivotTable or PivotChart views in an Access desktop database
Here is the related sql code snippet.
TRANSFORM sum(mobile_tb.sales) AS sales
SELECT mobile_tb.year
FROM mobile_tb
GROUP BY mobile_tb.year
PIVOT mobile_tb.brand;
For more information, please refer to: Pivot Query in MS Access
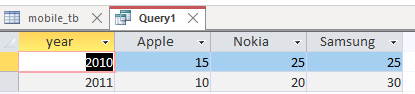
Original table
Pivoted
Best regards,
Zhanglong