Dear Sir or Madam,
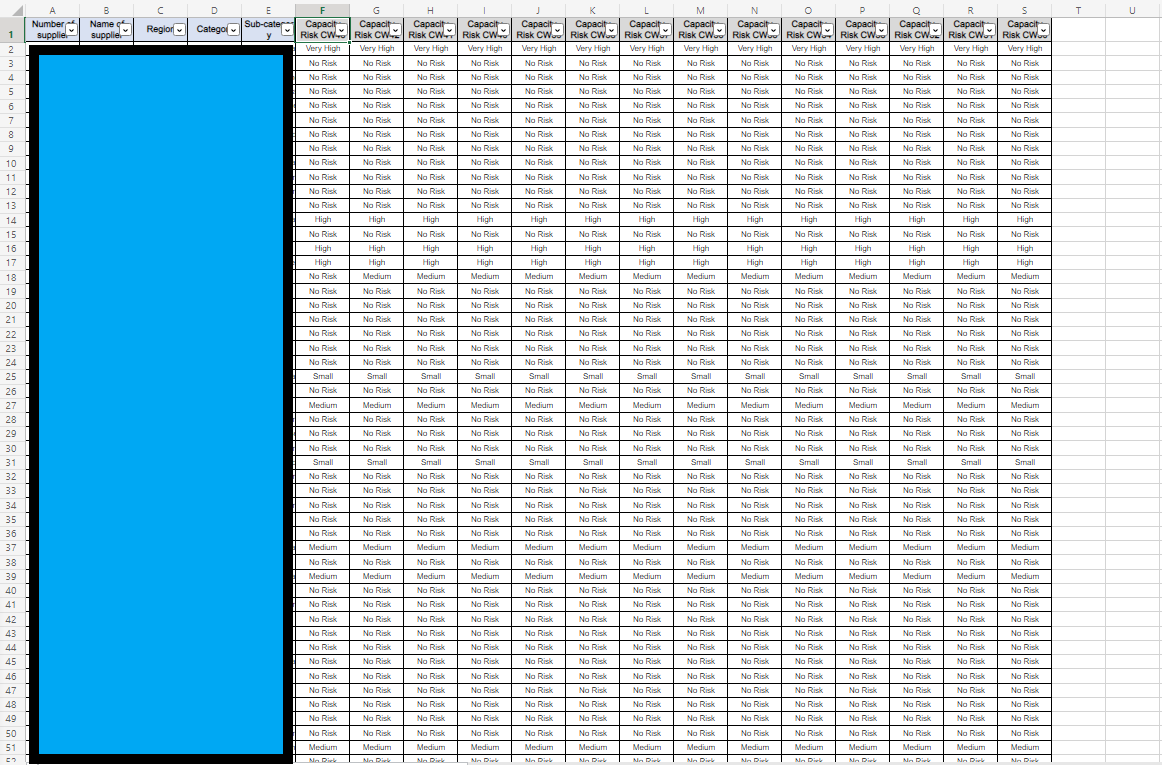
I have a macro/script (on Sharepoint) that adds one column with new tracking data through VLOOKUP in Excel worksheet every week (supported by Power Automate). The column of new data is always inserted to column "F", so the older columns from "F" to "R" are moving to "G" and "S", because there is a new column "F" with brand new generated data.
Is there any way to make the code to generate data in the every next column on the right? So it will look chronological in time. And every week there will be a brand new column with new data next to the full area of data etc. For example next week, the column "T" will have the data, next week same for column "U" and so on.
I asked the same question on this site and was moved to the script section: https://answers.microsoft.com/en-us/msoffice/forum/all/how-to-make-a-script-that-will-make-an-additional/31f11948-cb14-442a-97ab-d863425eee3d
Big thanks in advance!
Code:
function main(workbook: ExcelScript.Workbook) {
let selectedSheet = workbook.getActiveWorksheet();
// Insert at range F:F on selectedSheet, move existing cells right
selectedSheet.getRange("F:F").insert(ExcelScript.InsertShiftDirection.right);
// Auto fill range
selectedSheet.getRange("G1:H1").autoFill("F1:H1", ExcelScript.AutoFillType.fillDefault);
// Set range F2 on selectedSheet
selectedSheet.getRange("F2").setFormulaLocal("=VLOOKUP(A2,'[Global_Supplier_Risk_Tracking.xlsx](PAVE, RISK)_Supplier_Tracking'!$A:$T,20,NEPRAVDA)");
// Auto fill range
selectedSheet.getRange("F2").autoFill();
let europe_financial_risk_overview = workbook.getWorksheet("Europe financial risk overview");
// Set range B2 on europe_financial_risk_overview
europe_financial_risk_overview.getRange("B2").setFormulaLocal("=COUNTIFS(List1!$F:$F,'Europe financial risk overview'!A2,List1!C:C,\"Europe\")");
// Auto fill range
europe_financial_risk_overview.getRange("B2").autoFill("B2:B6", ExcelScript.AutoFillType.fillDefault);
let kontingen_n__tabulka6 = workbook.getPivotTable("Kontingenční tabulka6");
// Refresh kontingen_n__tabulka6
kontingen_n__tabulka6.refresh();
let global_financial_risk_overview = workbook.getWorksheet("Global financial risk overview");
// Set range B2 on global_financial_risk_overview
global_financial_risk_overview.getRange("B2").setFormulaLocal("=COUNTIF(List1!$F:$F,'Global financial risk overview'!A2)");
// Auto fill range
global_financial_risk_overview.getRange("B2").autoFill();
let kontingen_n__tabulka7 = workbook.getPivotTable("Kontingenční tabulka7");
// Refresh kontingen_n__tabulka7
kontingen_n__tabulka7.refresh();
}
' cx='32' cy='32' r='32' /%3E%3Ctext x='50%25' y='55%25' dominant-baseline='middle' text-anchor='middle' fill='%23FFF' %3EKJ%3C/text%3E%3C/svg%3E)