Visualization/plots/graphs executed successfully on PySpark in Azure Synapse but not showing up! Please help!!

angie578 1 Reputation point
2020-09-28T10:12:00.817+00:00

Visualization/plots/graphs executed successfully on PySpark in Azure Synapse but not showing up! Please help!!

Azure Synapse Analytics
An Azure analytics service that brings together data integration, enterprise data warehousing, and big data analytics. Previously known as Azure SQL Data Warehouse.
5,378 questions
{count} votes

2 answers

Sort by: Most helpful
  1. PRADEEPCHEEKATLA 90,651 Reputation points Moderator
    2020-09-29T09:00:14.237+00:00

    Hello @angie578 ,

    As per my repro, I'm able to see the Visualization/plots/graphs executed successfully on PySpark in Azure Synapse Analytics.
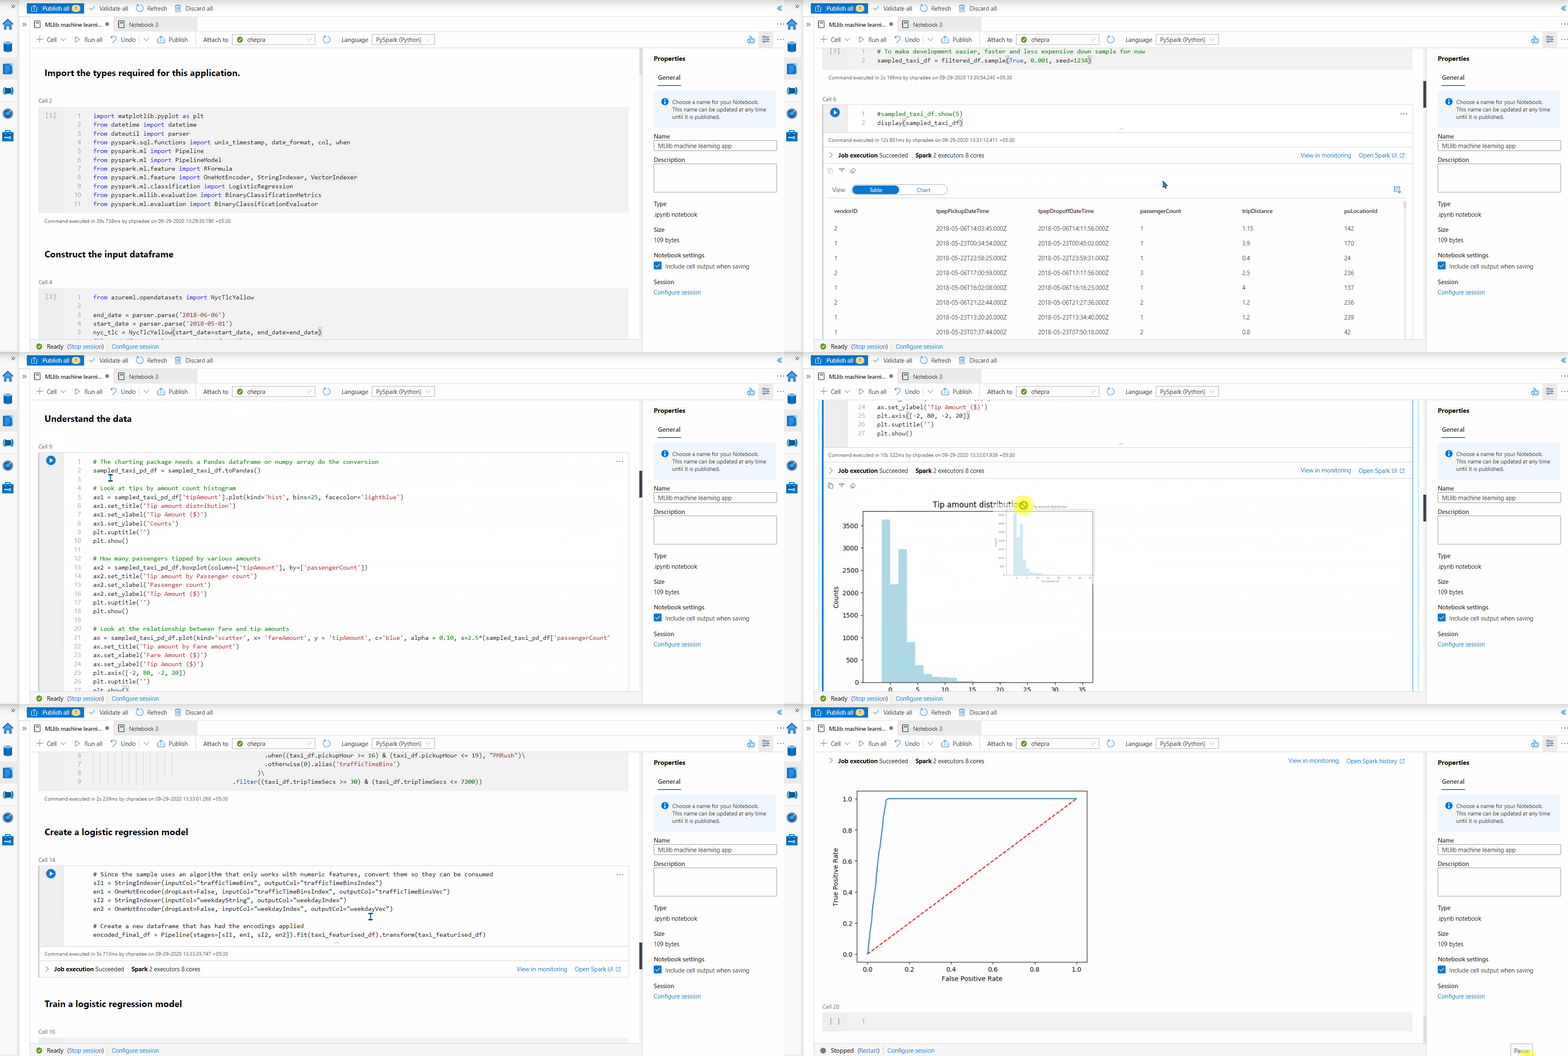
    29093-asa-plot.gif

    You may try the following steps and let us know.

    • Clear “Cookies and Cached data” of your browser.
    • Private Mode (New InPrivate Window).
    • Try in different browser.

    Reference: Build a machine learning app with Apache Spark MLlib and Azure Synapse Analytics

    Hope this helps. Do let us know if you any further queries.

    ----------------------------------------------------------------------------------------

    Do click on "Accept Answer" and Upvote on the post that helps you, this can be beneficial to other community members.


  2. Wipada Chanthaweethip 1 Reputation point
    2020-12-23T07:15:39.613+00:00

    I have the same issue too. Code is successfully run but no chart display. Do I need to configure some thing?
    50791-image.png


Your answer

Answers can be marked as Accepted Answers by the question author, which helps users to know the answer solved the author's problem.