SQL Server Reporting Services
A SQL Server technology that supports the creation, management, and delivery of both traditional, paper-oriented reports and interactive, web-based reports.
This browser is no longer supported.
Upgrade to Microsoft Edge to take advantage of the latest features, security updates, and technical support.
' cx='32' cy='32' r='32' /%3E%3Ctext x='50%25' y='55%25' dominant-baseline='middle' text-anchor='middle' fill='%23FFF' %3EI%3C/text%3E%3C/svg%3E)
I have a SSRS Scatter chart that I am trying to add StripLines to identify when the product changes. I have tried adding the expression in the StripLines Offset Interval section:
=IIF(Fields!FileName.Value <> Previous(Fields!FileName.Value), true, nothing)
But no StripLines appear.
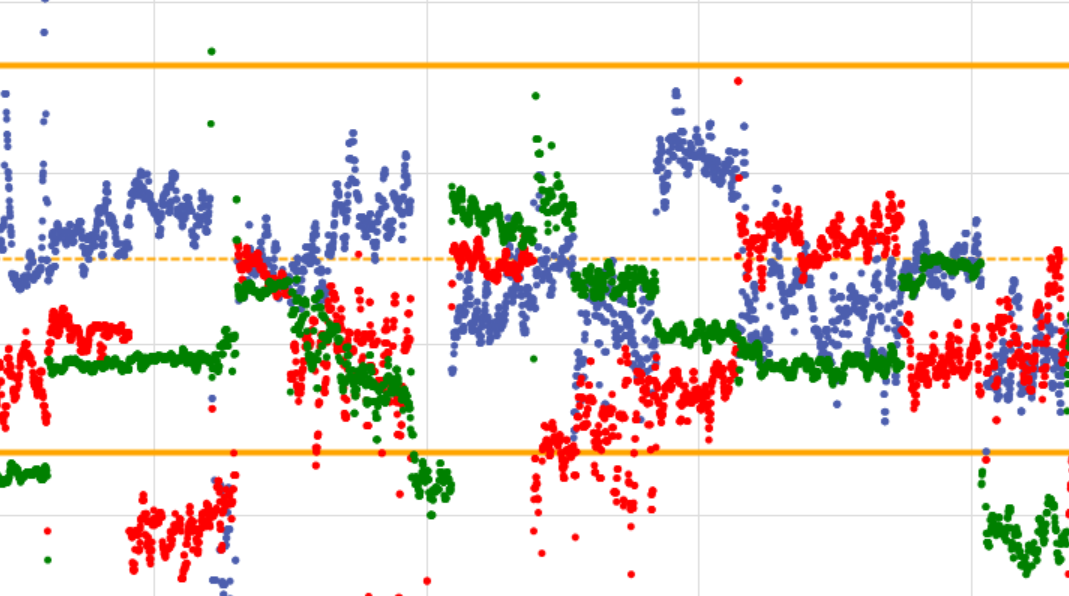
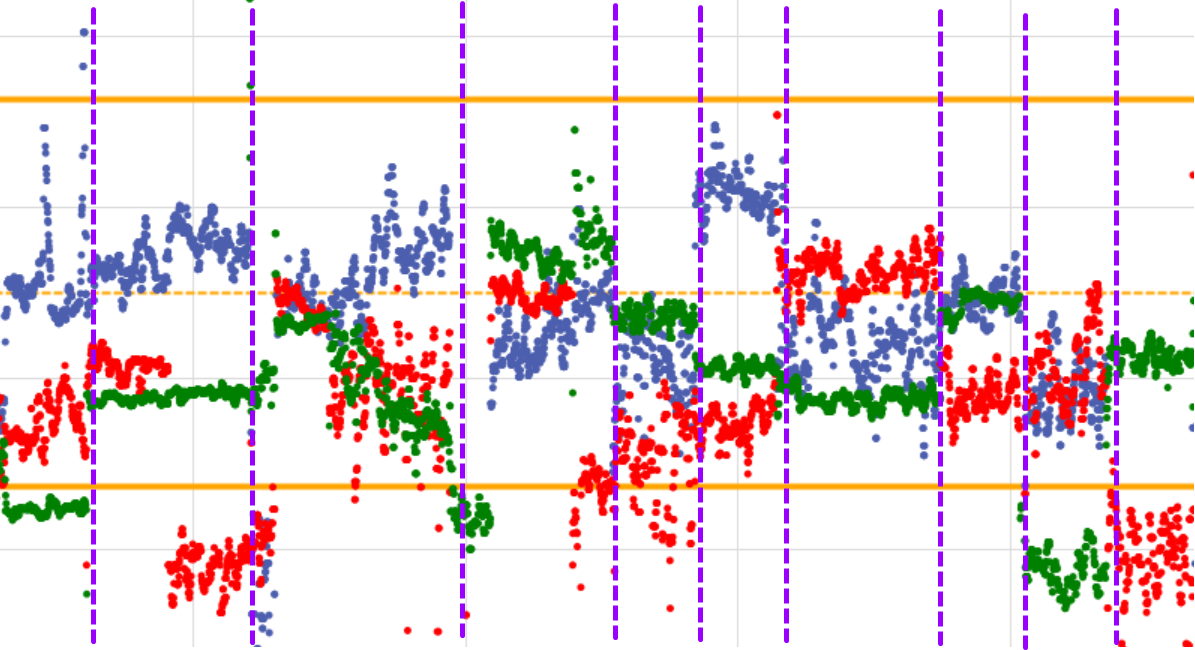
Ideally, the StripLines would be appearing where I drew the purple lines below. Any suggestions would be great!
A SQL Server technology that supports the creation, management, and delivery of both traditional, paper-oriented reports and interactive, web-based reports.
@ZoeHui-MSFT Will this work:

Hi @ihcc2uni ,thanks for your share. If there is no value in the X-axis ,we couldn't put the vertical line. I also tried to set a Row_Number column value, unluckily as you.
I assume that it is difficult to meet your needs.
Ok, thanks for trying. I'll be sure to post a solution if I can come up with one!
Hi @ZoeHui-MSFT ,
The backend data is sensitive. I'm trying to figure out a way to make it generic. I can give details on the axis. The X-axis is just a count of points displayed. The Y-Axis is how close the plotted point is to the required target, with 0 (orange dashed line) being the target. The two solid orange lines at 12 are considered acceptable values.
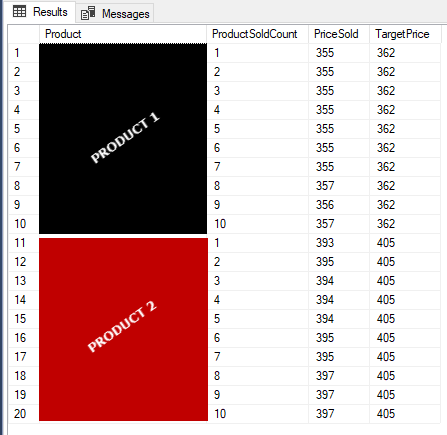
Basically the table format is Product Name, Product Sold Count, Price Sold and Target Price. The points on the graph is the different between Price Sold and Target Price. Each Product had a Product Sold count that starts at one. This counter resets when the product changes. My goal is to divide the chart by product like image above with purple dash lines.
I've tried the following with no luck
 =IIF(Fields!Product.Value <> Previous(Fields!Product.Value), true, nothing)

 =IIF(Fields!ProductSoldCount.Value > Previous(Fields!ProductSoldCount.Value), true, nothing)
I've also tried adding a Row_Number column and replacing true in above expressions to the Row_Number column value (which would align to the X-axis) to put vertical line at that point, but no luck either.
I have had it plot the first line at X-axis 0, but can't get strip lines after that to generate.
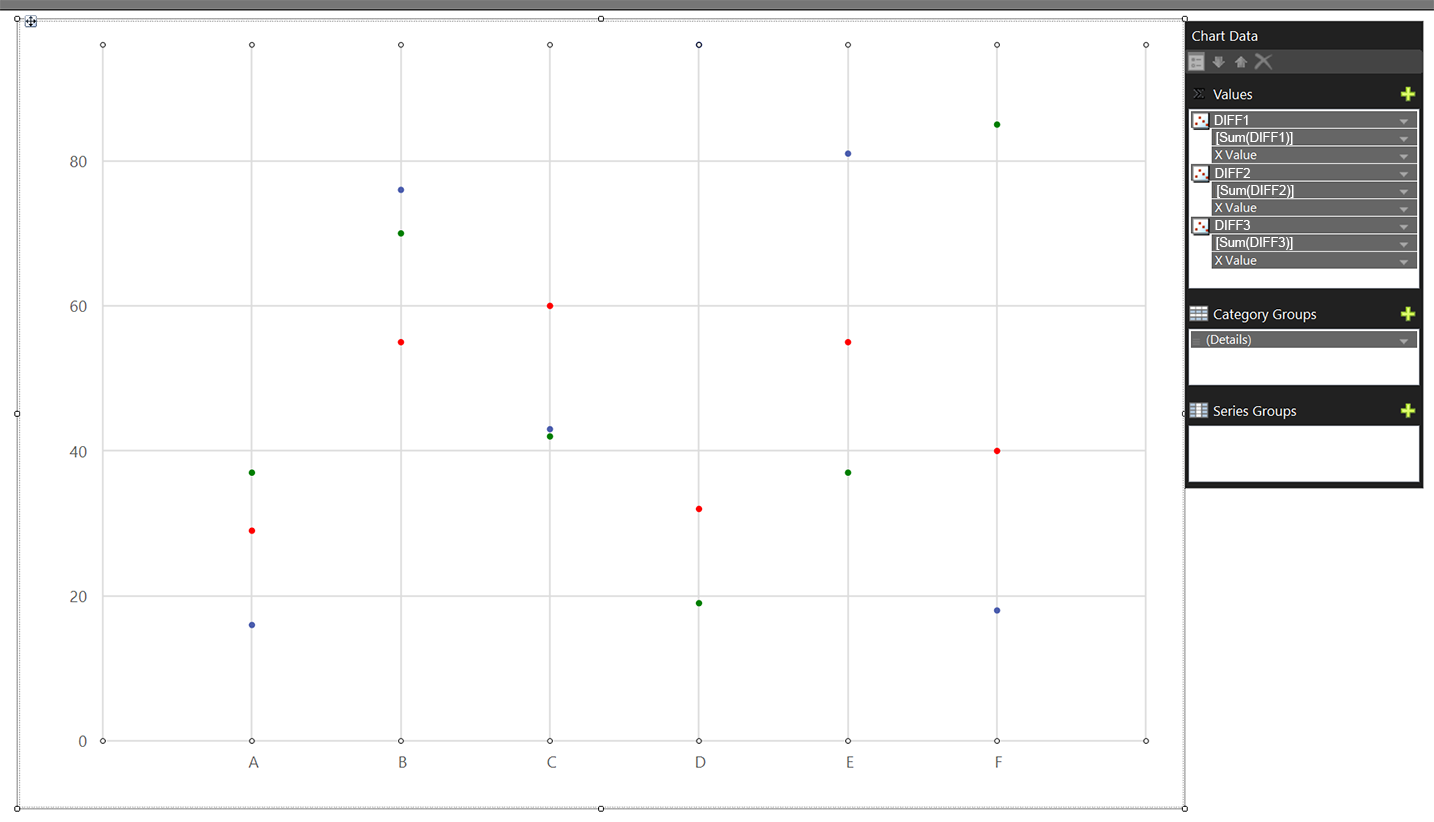
Hi @ihcc2uni ,thanks for your detail reply. Could you please share the chart sample with me like this. I couldn't fully get your meaning of the scatter.

Hi @ihcc2uni ,
Could you please share the chart data sample with us?
It's really hard for us to guess the value of X-axis and Y-axis.
With the sample data we could do more analysis to meet your needs.
Regards,
Zoe
If the answer is helpful, please click "Accept Answer" and upvote it.
Note: Please follow the steps in our documentation to enable e-mail notifications if you want to receive the related email notification for this thread.