Hi Anu,
about that counter, here is the information you wanted:
This is the data source Module Type:
MSSQL on Windows: CPU Utilization Mapped Provider
https://systemcenter.wiki/?GetElement=Microsoft.SQLServer.Windows.DataSource.CPUUtilizationMapped&Type=DataSourceModuleType&ManagementPack=Microsoft.SQLServer.Windows.Monitoring&Version=7.0.0.0
for the performance colletction rule:
Microsoft.SQLServer.Windows.CollectionRule.DBEngine.CPUUtilization (Rule)
https://systemcenter.wiki/?GetElement=Microsoft.SQLServer.Windows.CollectionRule.DBEngine.CPUUtilization&Type=Rule&ManagementPack=Microsoft.SQLServer.Windows.Monitoring&Version=7.0.0.0
The actual counter is:
        <ConditionDetection ID="Mapper" TypeID="SystemPerf!System.Performance.DataGenericMapper">
          <ObjectName>SQL DB Engine</ObjectName>
          <CounterName>CPU Utilization (%)</CounterName>
          <InstanceName/>
          <Value>$Data/Property[@Name='CPUUtilization']$</Value>
        </ConditionDetection>
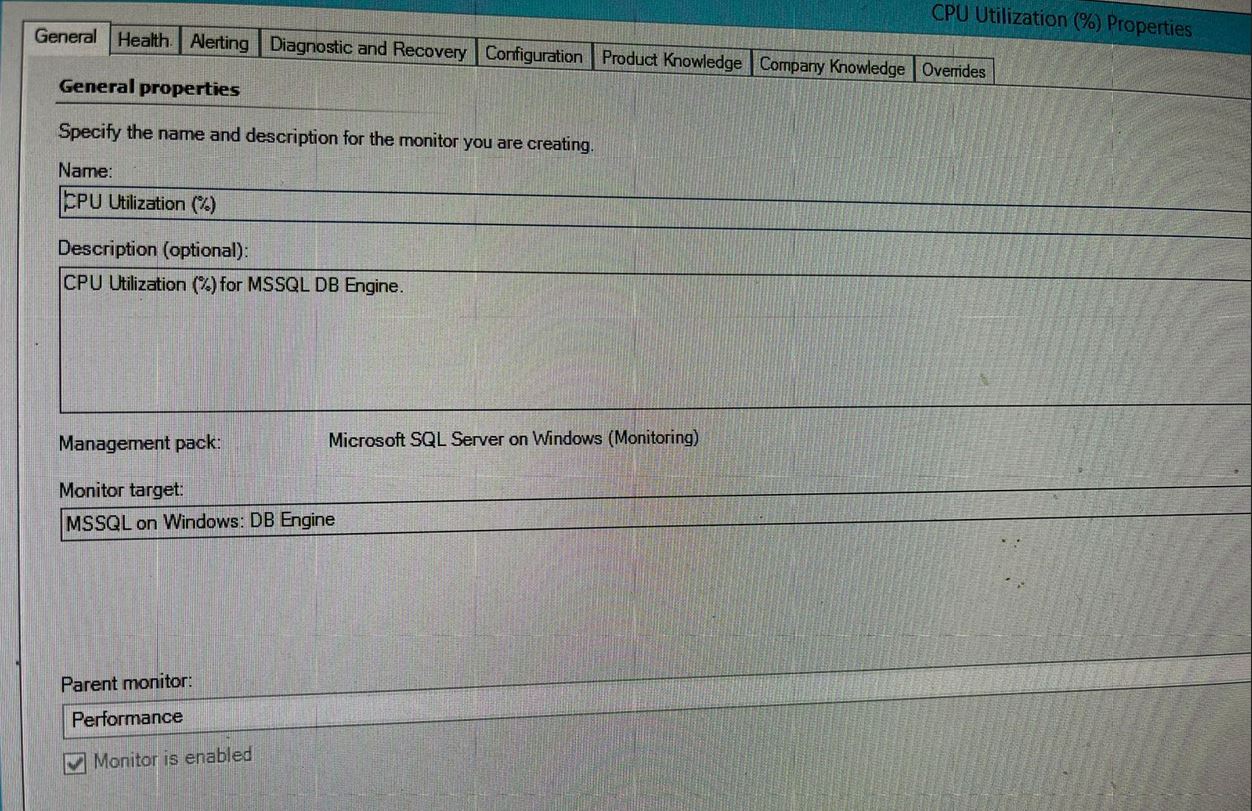
About the monitor:
Microsoft.SQLServer.Windows.MonitorType.DBEngine.CPUUtilization (UnitMonitorType)
https://systemcenter.wiki/?GetElement=Microsoft.SQLServer.Windows.MonitorType.DBEngine.CPUUtilization&Type=UnitMonitorType&ManagementPack=Microsoft.SQLServer.Windows.Monitoring&Version=7.0.0.0
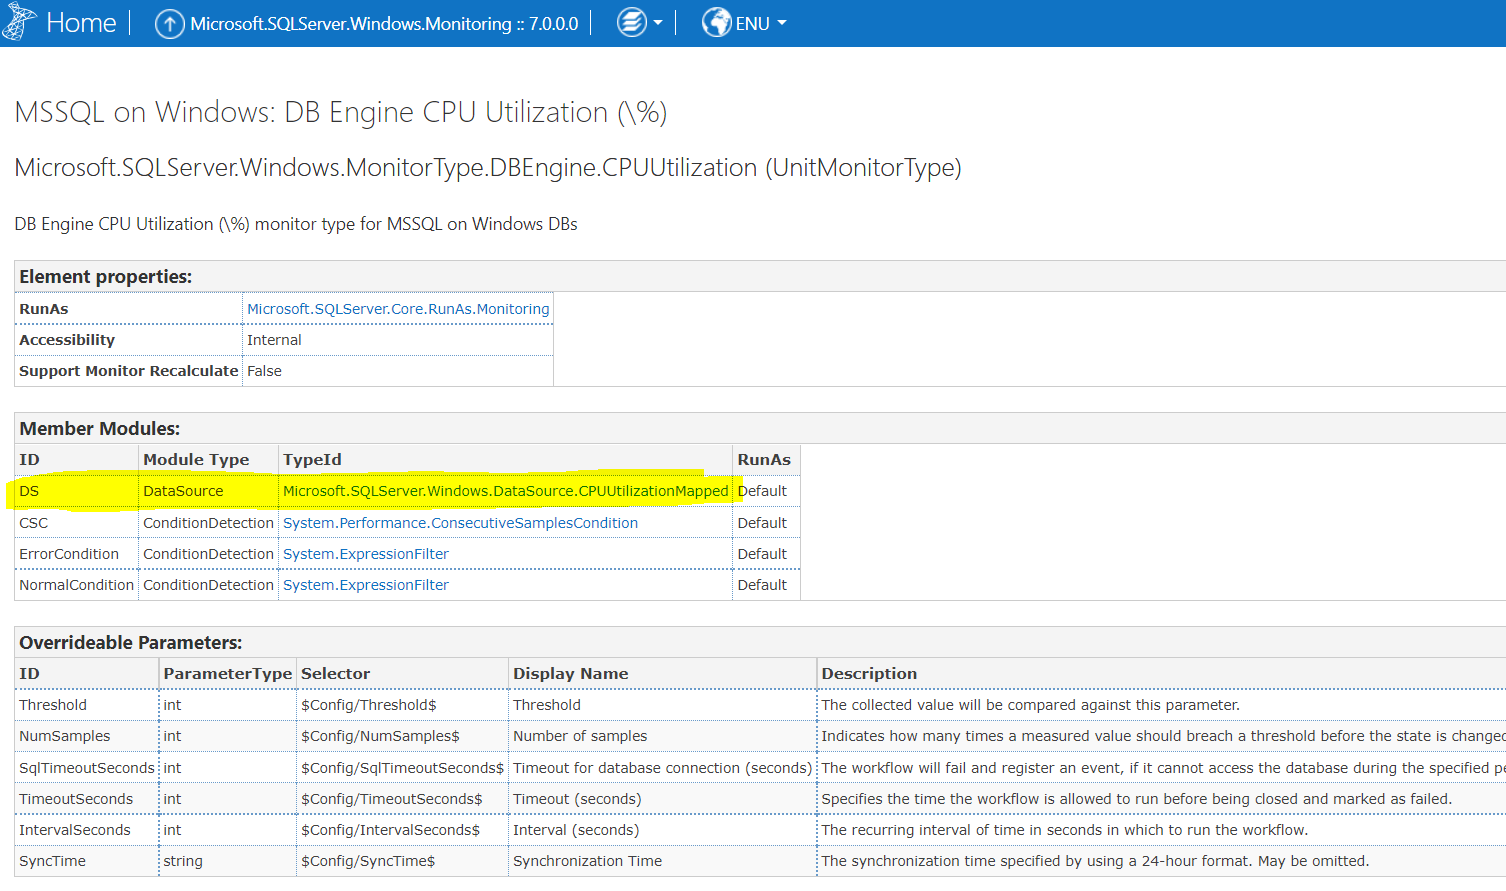
As you see from the screenshot, it uses the same data source, same counters.
The one is a performance collection rule, which gathers the counter, the other is a monitor, based on the same counter.
About the value being over 100%, I think this coould also play a role (from the rule link):
Percentage of CPU utilization depends on the processors affinity mask is set for the SQL Server instance. If the affinity mask is set automatically for all processors, the accumulated value will be counted with consideration for all processors’ cores according to the SQL Server edition.
Hope this helps.
----------
(If the reply was helpful please don't forget to upvote and/or accept as answer, thank you)
Regards
Stoyan Chalakov
' cx='32' cy='32' r='32' /%3E%3Ctext x='50%25' y='55%25' dominant-baseline='middle' text-anchor='middle' fill='%23FFF' %3EA%3C/text%3E%3C/svg%3E)