Microsoft 365 and Office | Excel | For business | Windows
A family of Microsoft spreadsheet software with tools for analyzing, charting, and communicating data
This browser is no longer supported.
Upgrade to Microsoft Edge to take advantage of the latest features, security updates, and technical support.
' cx='32' cy='32' r='32' /%3E%3Ctext x='50%25' y='55%25' dominant-baseline='middle' text-anchor='middle' fill='%23FFF' %3EA%3C/text%3E%3C/svg%3E)
Hi,
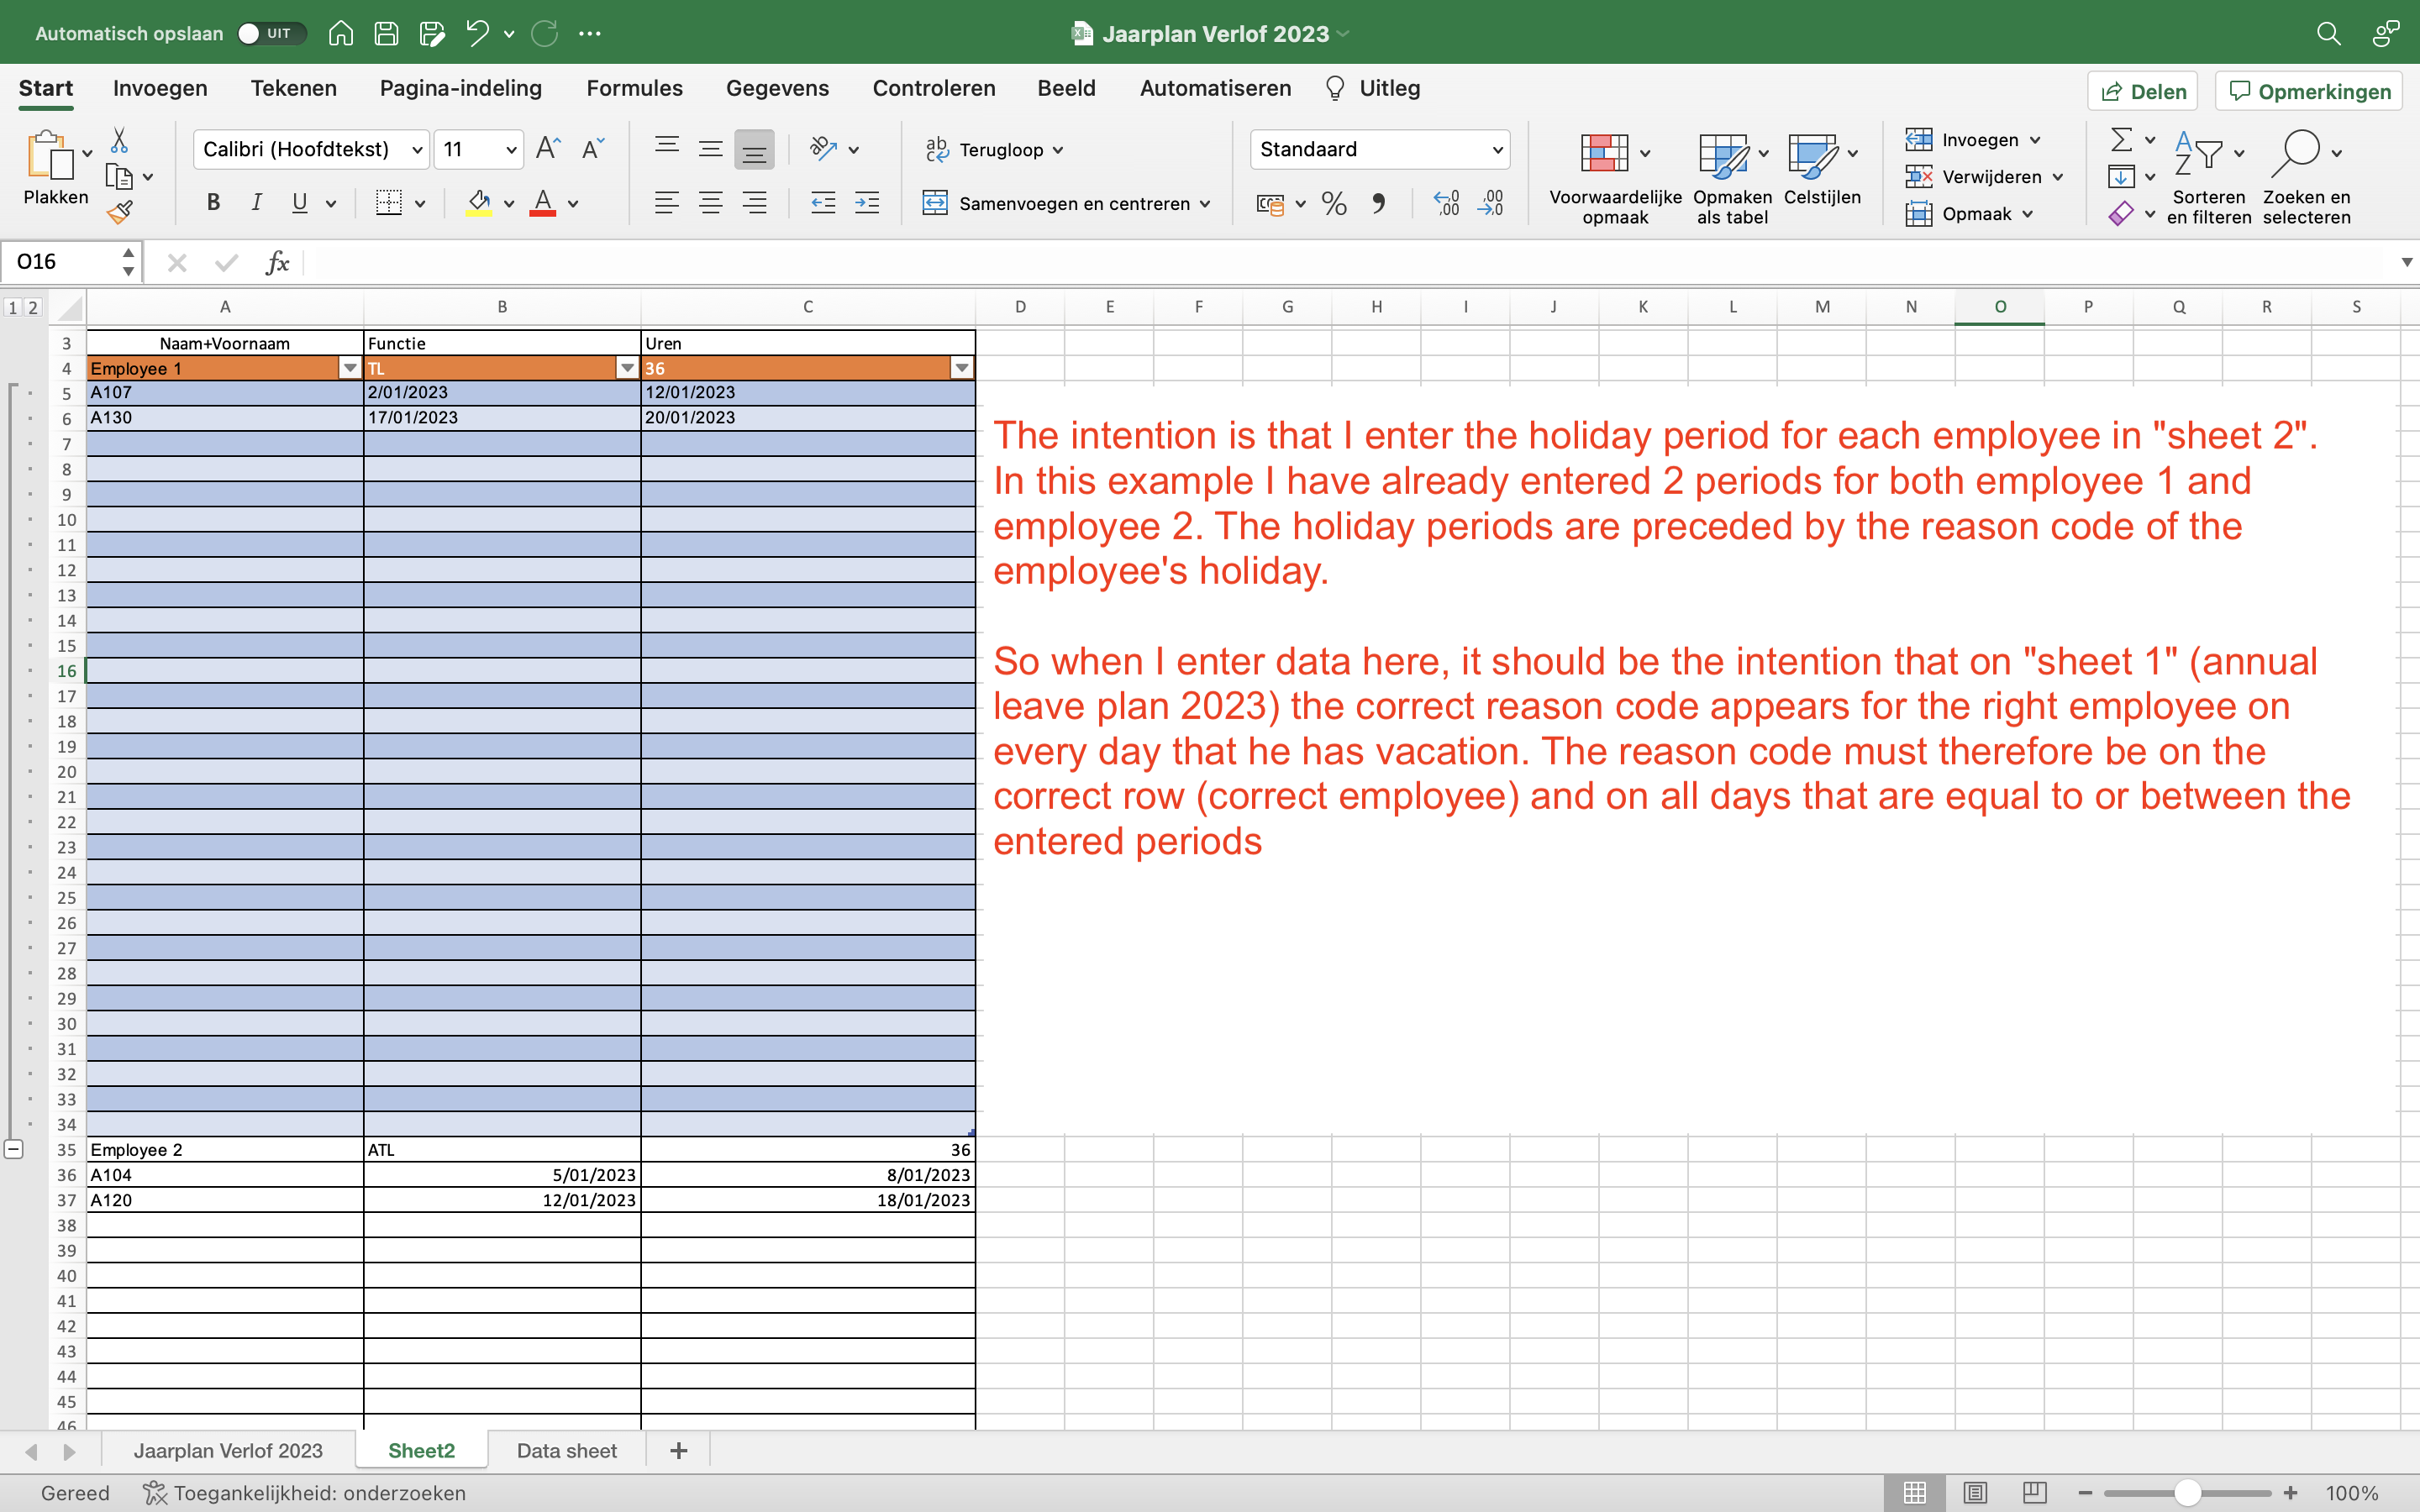
I am trying to make an employee leave overview chart.
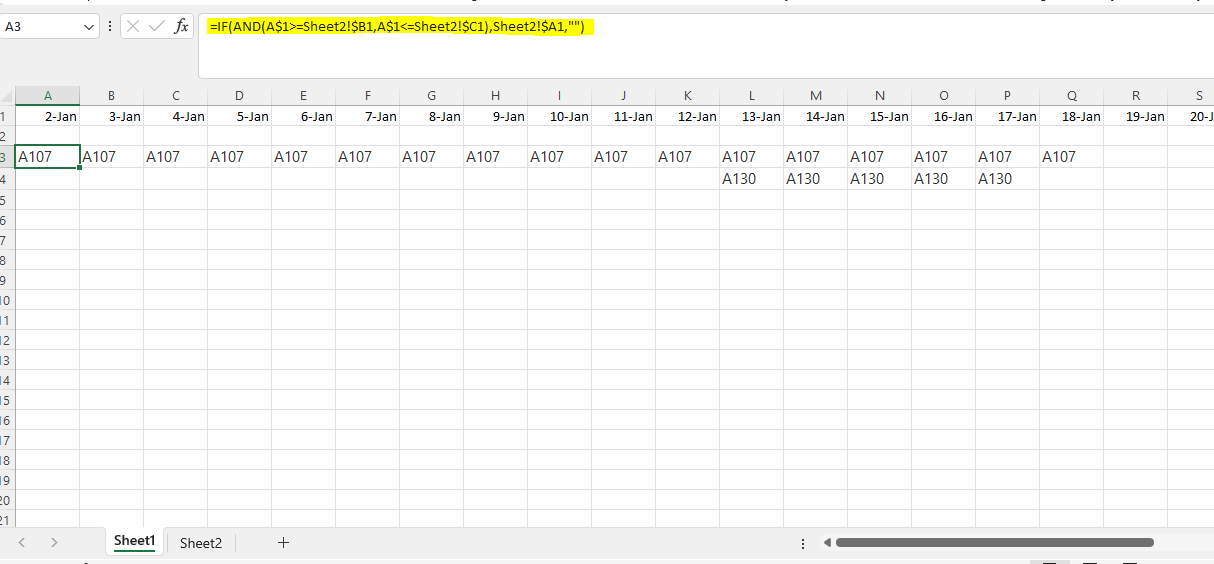
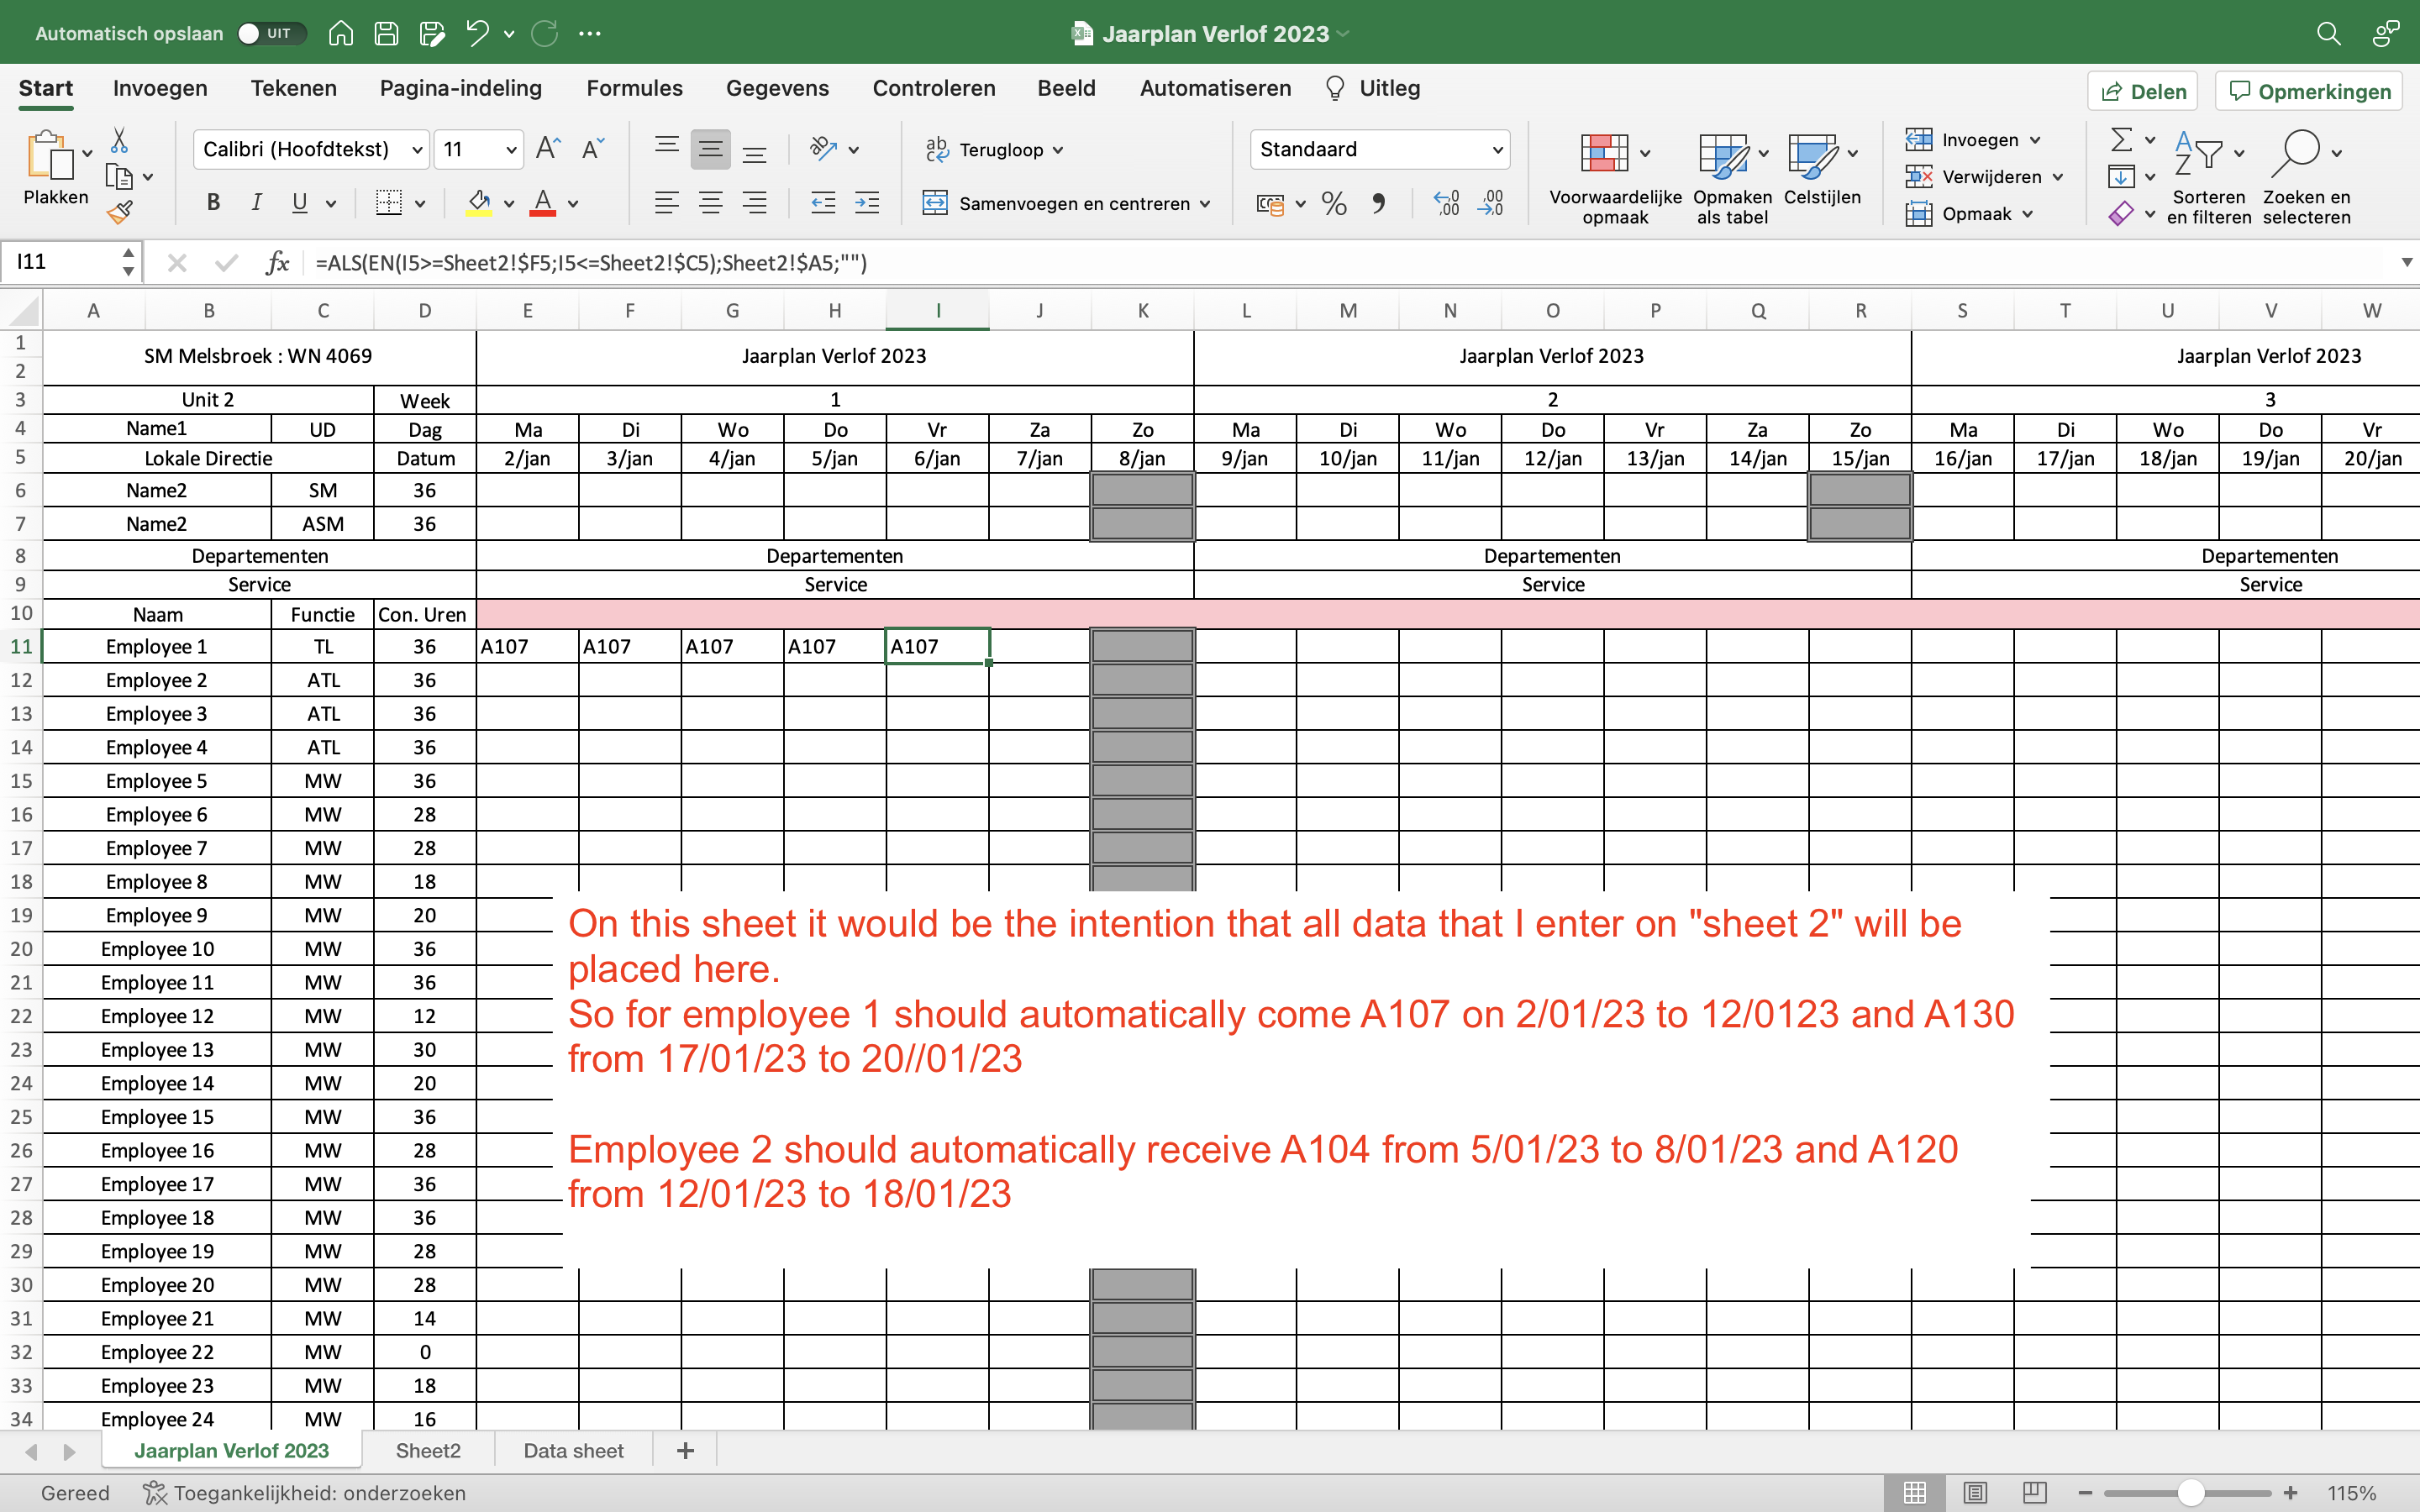
The idea is that when I add a start date and an end date in picture two, the reason code in the cell before those dates is generated on all the dates on picture one that are inbetween all the ranges from picture 2.
Like you can see it worked for the first line. I used:
IF(AND(I5>=Sheet2!F5;'Jaarplan Verlof 2023'!I5<=Sheet2!$C$5);Sheet2!$A$5;"")
but this only workes for the forst row on picture two. How can i make this work for all the date ranges I add in picture two?


' cx='32' cy='32' r='32' /%3E%3Ctext x='50%25' y='55%25' dominant-baseline='middle' text-anchor='middle' fill='%23FFF' %3EHS%3C/text%3E%3C/svg%3E)
Excel 365 Pro Plus with Power Pivot and Power Query.
Leave overview chart.
Starting with blank slate.
No formulas, optional VBA macro for chart formatting.
With Gantt chart.
https://www.mediafire.com/file/9h1sceshv4fxlm8/12_13_22.xlsm/file
https://www.mediafire.com/file/n0qhgf5ddlixy0x/12_13_22.pdf/file
' cx='32' cy='32' r='32' /%3E%3Ctext x='50%25' y='55%25' dominant-baseline='middle' text-anchor='middle' fill='%23FFF' %3EAZ%3C/text%3E%3C/svg%3E)
Hi,
I don't understand your requirement clearly. But, can try removing "$" in Sheet2 cells as below?
IF(AND(I5>=Sheet2!F5;'Jaarplan Verlof 2023'!I5<=Sheet2!$C5);Sheet2!$A5;"")

Hi @YasserBenMessaoud-1625
Please check whether my following formula is helpful.
=IF(AND(I$5>=Sheet2!$F5;'Jaarplan Verlof 2023'!I$5<=Sheet2!$C5);Sheet2!$A5;"")
On my simple sample, I get the following results, you can have a check. Any misunderstandings, you can feel free to post back.

If the answer is helpful, please click "Accept Answer" and kindly upvote it. If you have extra questions about this answer, please click "Comment".
Note: Please follow the steps in our documentation to enable e-mail notifications if you want to receive the related email notification for this thread.
hello, thanks. this is not quite what i mean. I added some clarification to the screenshot here
Hi @YasserBenMessaoud-1625
If you have a chance to be back, please check whether HerbertSeidenberg-6295's suggestions are helpful.