Azure Monitor
An Azure service that is used to collect, analyze, and act on telemetry data from Azure and on-premises environments.
3,658 questions
This browser is no longer supported.
Upgrade to Microsoft Edge to take advantage of the latest features, security updates, and technical support.
' cx='32' cy='32' r='32' /%3E%3Ctext x='50%25' y='55%25' dominant-baseline='middle' text-anchor='middle' fill='%23FFF' %3ECP%3C/text%3E%3C/svg%3E)
Hi,
I'm currently using this KQL to show the %age of disk space per computer, and each disk they have.
InsightsMetrics
| where TimeGenerated > ago(24h)
| where Origin == "vm.azm.ms"
| where Namespace == "LogicalDisk" and Name == "FreeSpacePercentage"
| extend Disk=tostring(todynamic(Tags)["vm.azm.ms/mountId"])
| summarize AggregatedValue = avg(Val) by bin(TimeGenerated, 1m), Computer, _ResourceId, Disk
I'd like this in a time chart, but when I simply add | render timechart is only shows what must be the total of all disks per computer
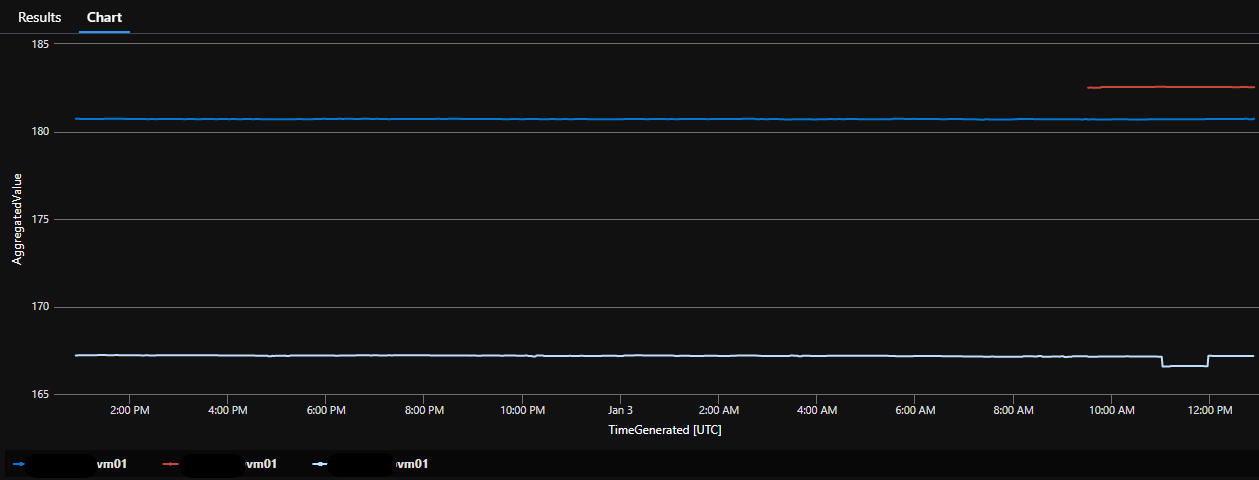
How do I show each disk of each computer in a timechart?
' cx='32' cy='32' r='32' /%3E%3Ctext x='50%25' y='55%25' dominant-baseline='middle' text-anchor='middle' fill='%23FFF' %3EAM%3C/text%3E%3C/svg%3E)
@Chris Peacock , Following up to check if you had a chance to review the answers below. Please let us know if you have any questions.
Please 'Accept as answer' if it helped so that it can help others in the community looking for help on similar topics.

That is a lot of data points for one chart. Maybe something like this:
InsightsMetrics
| where TimeGenerated > ago(24h)
| where Origin == "vm.azm.ms"
| where Namespace == "LogicalDisk" and Name == "FreeSpacePercentage"
| where parse_json(Tags).["vm.azm.ms/mountId"] matches regex "[A-Z]:"
| extend Disk=strcat(Computer, " ", parse_json(Tags).["vm.azm.ms/mountId"])
| summarize count() by bin(TimeGenerated, 10m), Disk, Val
| render timechart

@Andrew Blumhardt . Why have you summarised by count() ? This would give the number of unique samples by the Disk / Val combination in a 10 minute window.
I would use avg() or for disks, max()
InsightsMetrics
| where TimeGenerated > ago(24h)
| where Origin == "vm.azm.ms"
| where Namespace == "LogicalDisk" and Name == "FreeSpacePercentage"
| where parse_json(Tags).["vm.azm.ms/mountId"] matches regex "[A-Z]:"
| extend Disk=strcat(Computer, " ", parse_json(Tags).["vm.azm.ms/mountId"])
//| summarize Average = avg(Val) by Disk, bin(TimeGenerated, 10m)
| summarize Max = max(Val) by Disk, bin(TimeGenerated, 10m)
| render timechart
I agree there are too many data points for a larger number of computers / disks. Consider looking at small time samples (1m , 5m etc) when looking at less data (either time range or less disks) as they may not all show on the chart
1 minute samples = 1440 data points per disk per day. Log Analytics can only render 30,000 therefore you would only be able to display 20 disks across 24 hours with a complete data set.
Just cut and paste from my KQL notes on the count(). Binning may not help either. You need some form of summarization to render a good chart. Consider that disk space should not change significantly over time for most disks. Longer samples will render better.
InsightsMetrics
| where TimeGenerated > ago(24h)
| where Origin == "vm.azm.ms"
| where Namespace == "LogicalDisk" and Name == "FreeSpacePercentage"
| where parse_json(Tags).["vm.azm.ms/mountId"] matches regex "[A-Z]:"
| extend Disk=strcat(Computer, " ", parse_json(Tags).["vm.azm.ms/mountId"])
| summarize AggregatedValue = avg(Val) by bin(TimeGenerated, 1h), Disk