As part of the performance benchmarking to decide the right scaling configuration for our Function Apps on Elastic Premium Plan, we carried out a test to process approximately 10,000 files. Those files are placed on the specific container on an Azure Blob Storage (General Purpose Storage V2 with ZRS). There is an Azure Function which has a blob trigger on that container to processes those file and route them accordingly.
The scale out configuration for that Function App is set to 3 always instances and the Windows Elastic Premium Plan EP2 is configured with Availability Zone support and scaling b/w 3 to 5 nodes (screenshot below for reference):

Post the completion of file processing, and in order to confirm that the function app is scaling out and in as expected and as per the configuration, we executed the following query in Azure Application Insights.
requests
| where timestamp > ago(1h) and operation_Name == "REDACTED"
| summarize count() by cloud_RoleInstance, bin(timestamp, 1m)
| render timechart
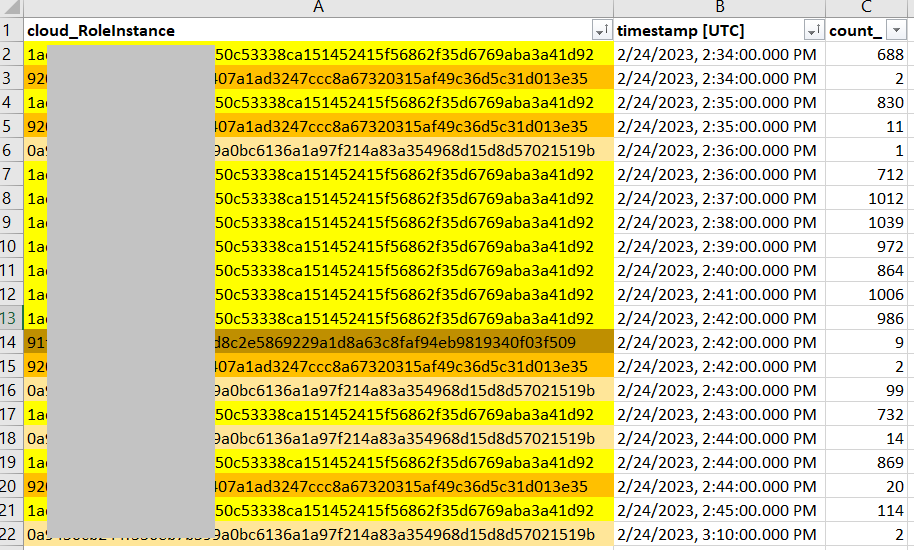
The results from that were a bit un-usual in the sense that out of the 3 always ready instances, only two instances were processing the requests, and moreover the "almost all" the requests were handled by one instance:

And here is the summary of which cloud role instance processed how many files in total:

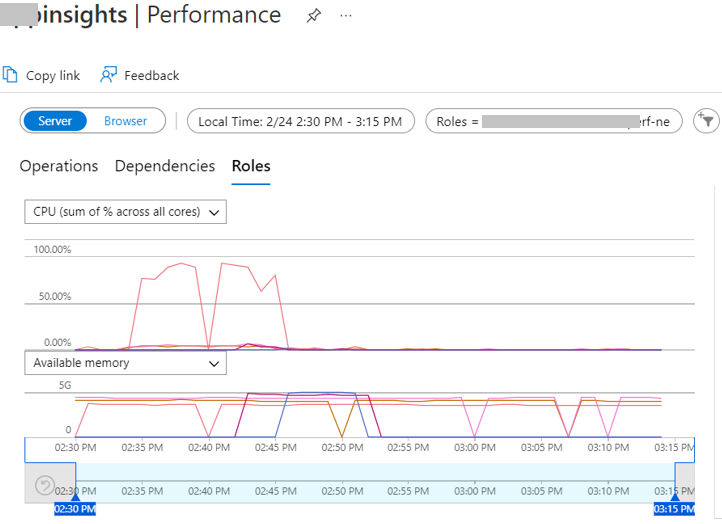
On looking at the CPU Utilization of the Cloud Role Instances, we noticed that the cloud role instance that handled almost all the load was running very high on CPU, touch 90%+ utilization, while the other cloud role instances were running at 10% or lower CPU Utilization. See screenshot below:

Moreover, looking at the function execution performance, we can see that their was latency in executions for as much as 5.670 seconds:

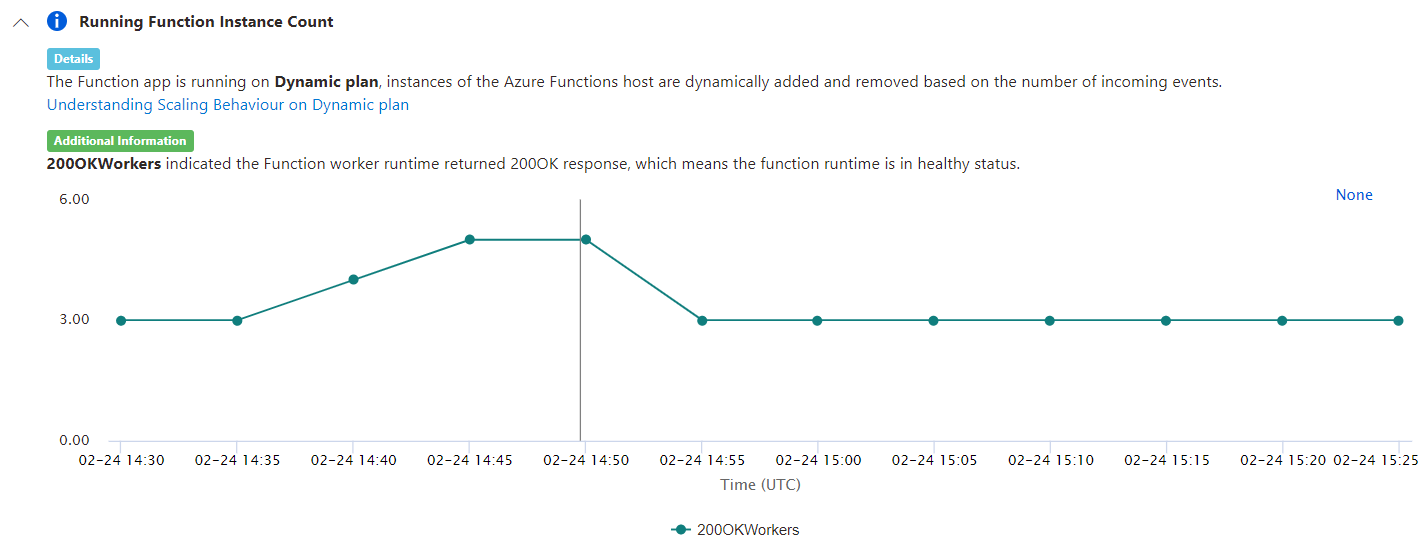
Please note that these executions happened in the 11 minute window b/w 02:34 PM to 02:45 PM, and the Elastic Premium Plan did scale out and scaled in as expected.

This raises a couple of questions for us:
- Why only one specific instance ended up in picking almost all the load i.e., processing almost all the the files uploaded on the blob, even when it was running significantly high on CPU, while the other cloud role instances were running fairly light and still not processing the files from the blob trigger?
- Why only 2 cloud instances were processing the requests most of the time, when the scale out configuration is set to 3 always ready instances with no scale out limit i.e., it can go up to 5 (the limit set on App Service Plan to avoid any bill shock during this initial benchmarking exercise).
The functions are coded in C#, .NET 6.
Please note that this specific behaviour is noticed in Blob Triggered Functions only. We have seen a fairly balanced distribution of load for Service Bus Triggered and HTTP triggered functions on the same App Service Plan. Not sure if there is any kind of zonal affinity coming into play here (please note that the storage account on which the blob trigger is set up is ZRS, and the App Service Plan is Windows EP2 with Zone Redundancy too)? But what's not understandable is why such imbalanced load distribution is only affecting this blob triggered function and not the Service Bus or HTTP Triggered Functions on the same App Service Plan?
Would appreciate any insights on this behaviour, so that we can adjust our configuration and implementation to make full use of all the available instances in our App Service Plan.
