Hello!
I've developed an ETL service using Azure Durable Functions, which involves the following components:
- A time-triggered function (Starter)
- The main orchestrator
- The etl sub-orchestrator
- Activity functions for reading, transforming, and writing data
- A durable entity for storing additional data.
Here's how the workflow works:
- The time-triggered function starts the main orchestrator.
- The main orchestrator calls an activity function that returns the number of data to be processed (70,000 JSON files).
- The main orchestrator creates a matrix of ETL-Orchestrators, with each group containing 50 ETL-Orchestrators.
- The main orchestrator calls each array of ETL-Orchestrators (using task.all) sequentially.
     while (index < groupedEtlOrchestrators.length) {
         yield context.df.Task.all(groupedEtlOrchestrators[index]);
         index += 1;
       }
- The ETL-Orchestrator:
- Starts the reader activity (reads 1000 json files)
- Starts the transformer activity (transform 1000 json files)
- Starts the writer activity (sequentially insert/update 1000 json files to CosmosDb)
- Starts 2 durable activities in parallel that deduplicate additional database and store it using the state.
- After all sub-orchestrators are done
- The main orchestrator starts 2 durable activities that contain 10,000 JSON files. (it takes all data)
- The main orchestrator starts 10 activity functions, with each function inserting/updating 1,000 JSON files.
- The main orchestrator starts 1 activity function for changing CosmosDB throughput.
- The main orchestrator starts 2 durable entities and 1 activity function in parallel to release resources used by durable activities and close database connections.
Here's what happens when the function is executed:
- The first group of ETL Orchestrators (10 sub-orchestrators) are executed quickly and complete in 2 minutes (including reading/transforming/writing and temp-storage activities).
- For the other groups, there are significant delays between executions (The execution time for each group increases every time the previous group is completed). It appears that a lot of activities are added to a queue for an instance that is still in use, as the other instances are not being utilized.
- While I have 10 instances, only 8 are used for the first group, and the number of used instances decreases significantly for the subsequent groups.
- After all sub-orchestrators are done, it takes a long time to start the next activities from the main orchestrator. At this point, the number of instances is reduced to 1-2.
When I start the service with only 1 group of 10 ETL-Orchestrators, it takes 2 minutes to complete. However, when I have 7 groups, it does not take 7 * 2 minutes to finish.
Configuration:
- Plan: Premium - 3.5GB memory for each instance
- Instances: 10
- Host.json
- Because there is an activity function in the ETL Orchestrator that uses more CPU to process all data, I believe it is better to limit the number of concurrentActivity functions that can run on the same instance. Should I reduce this number to 2? (I need 2 because there will be 2 durable entities running in parallel); should I also reduce maxConcurrentOrchestratorFunctions to 1? But I don't think this is helpful because the orchestrator is "done" once it begins a new activity.
  "extensions": {
    "durableTask": {
      "tracing": {
        "traceInputsAndOutputs": false,
        "traceReplayEvents": false
      },
      "maxConcurrentActivityFunctions": 5,
      "maxConcurrentOrchestratorFunctions": 5
    }
  }
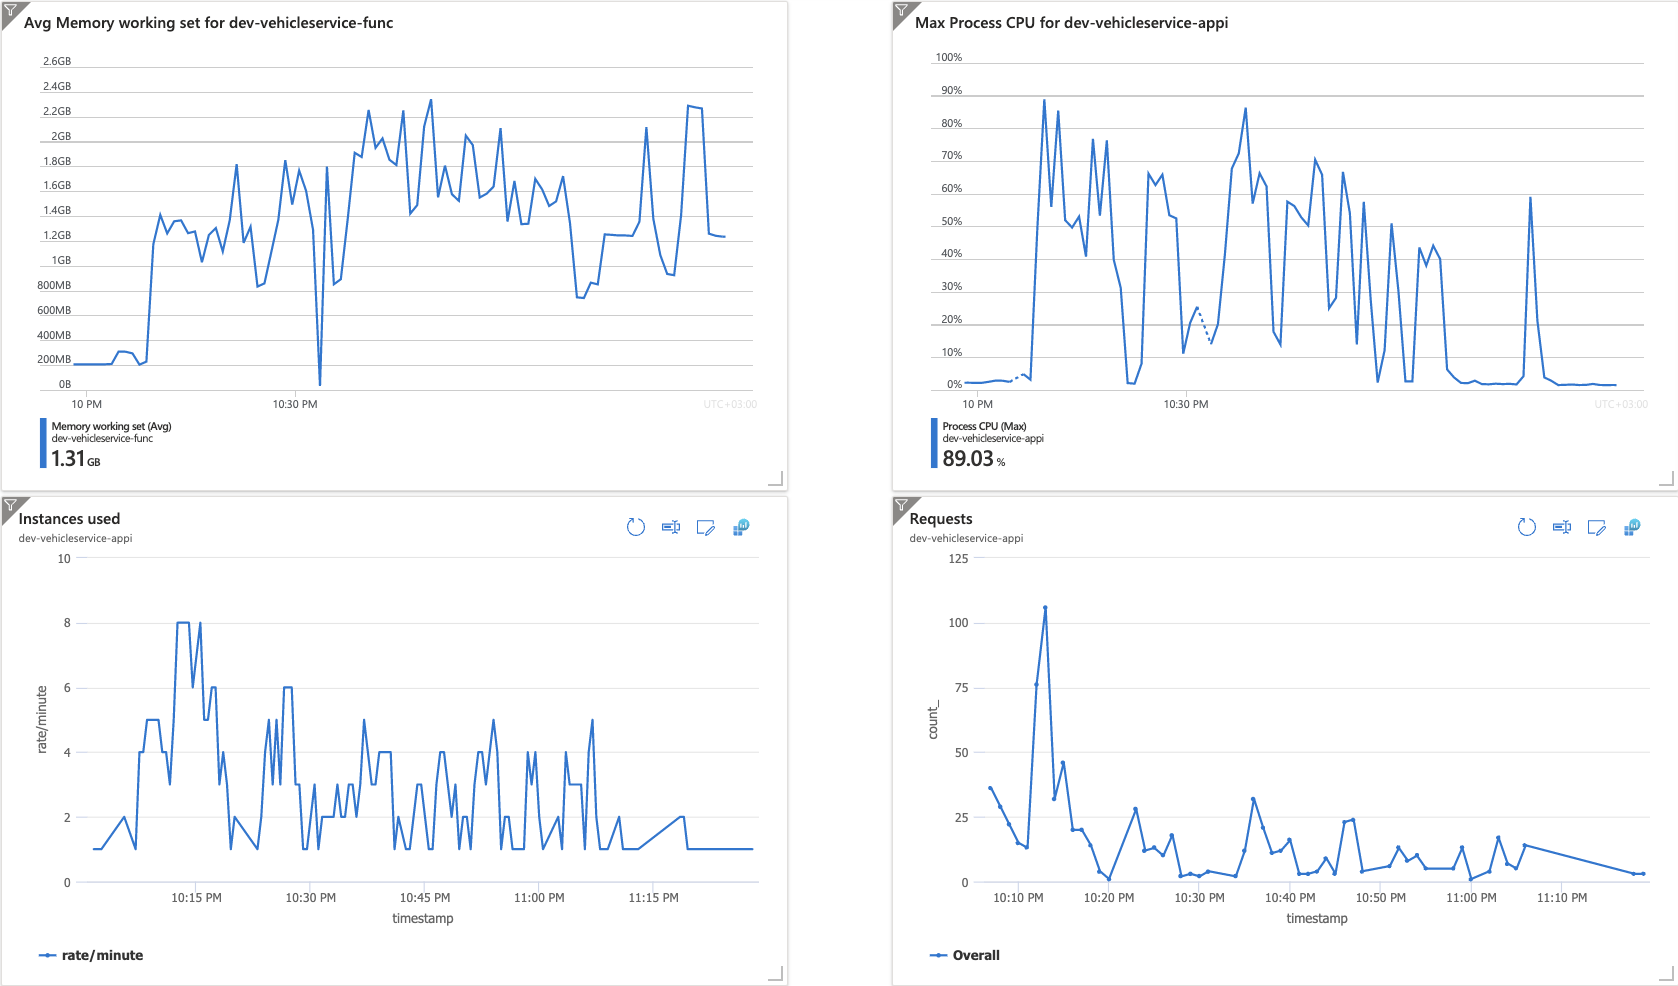
Although the expectation was to maintain similar levels of CPU usage, number of instances used, and number of requests throughout the execution, I observed the following:
- The number of requests decreased.
- The number of instances used decreased.
- The CPU usage decreased.

I've checked the logs and I found these:
- 3 x Singleton lock renewal failed for blob 'myfunc/host' with error code 409: LeaseIdMismatchWithLeaseOperation. The last successful renewal completed at 2023-03-29T19:33:29.954Z (11695 milliseconds ago) with a duration of 10884 milliseconds. The lease period was 15000 milliseconds. ( I have only one Function App in the service plan)
- 18 x Possible thread pool starvation detected.
- 125 x [HostMonitor] Host CPU threshold exceeded (91 >= 80)
This is a significant problem because for each execution, I increase the throughput of Cosmos DB. Due to the delay and non-execution of activities, the time it takes has increased from 30 minutes to 90 minutes. Consequently, Cosmos DB costs increase even if the Request Units (RU/s) are not utilized.