We were experimenting high request time randomly in the day (not especially during high traffic periods).

Some requests took more than 1 minute.
We hosts 4 app service on the same plan (single instance / Standard S3) and the problem seems related to a specific one (the Rest API) which is the most resource consuming.
The app is running on the last .Net 7 framework version using Azure SQL and Azure storage service.
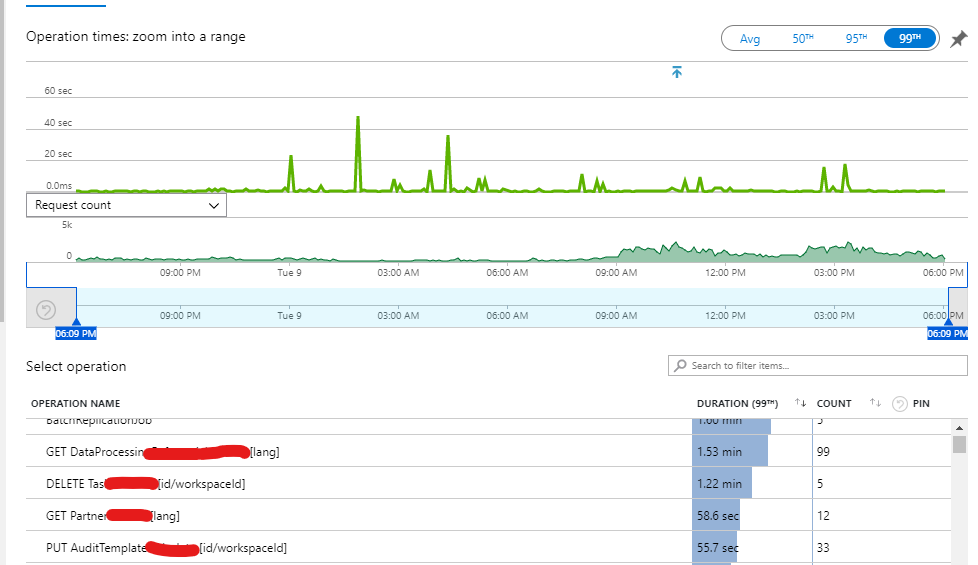
We investigate the type of request involved :
And we didn't found any typical request which might cause the performance issue. It depends. When the server is in idle mod, a few type of requests are concerned (Up to 30 requests are slow down)
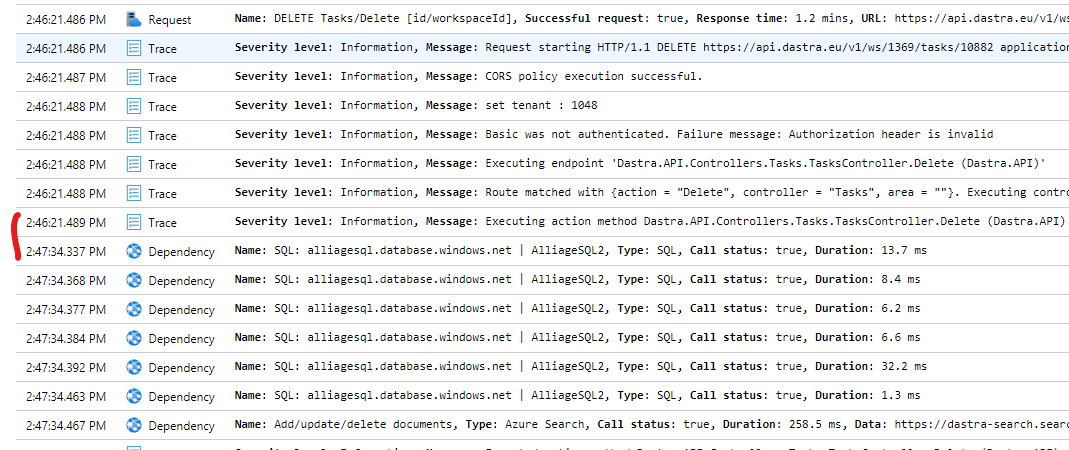
If I look into the details of a specific query, I have got this log :

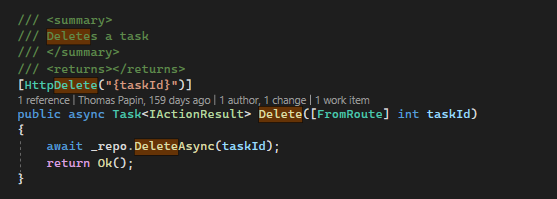
In my application code, I'm just schematically doing this (nothing is done before calling the repo which perform Db requests)
:
If I look into the information logs, most of the time consumed is between the "Executing Action" log and the first SQL request :
I see there is some CPU spikes during the latency (when we set the Max metric)
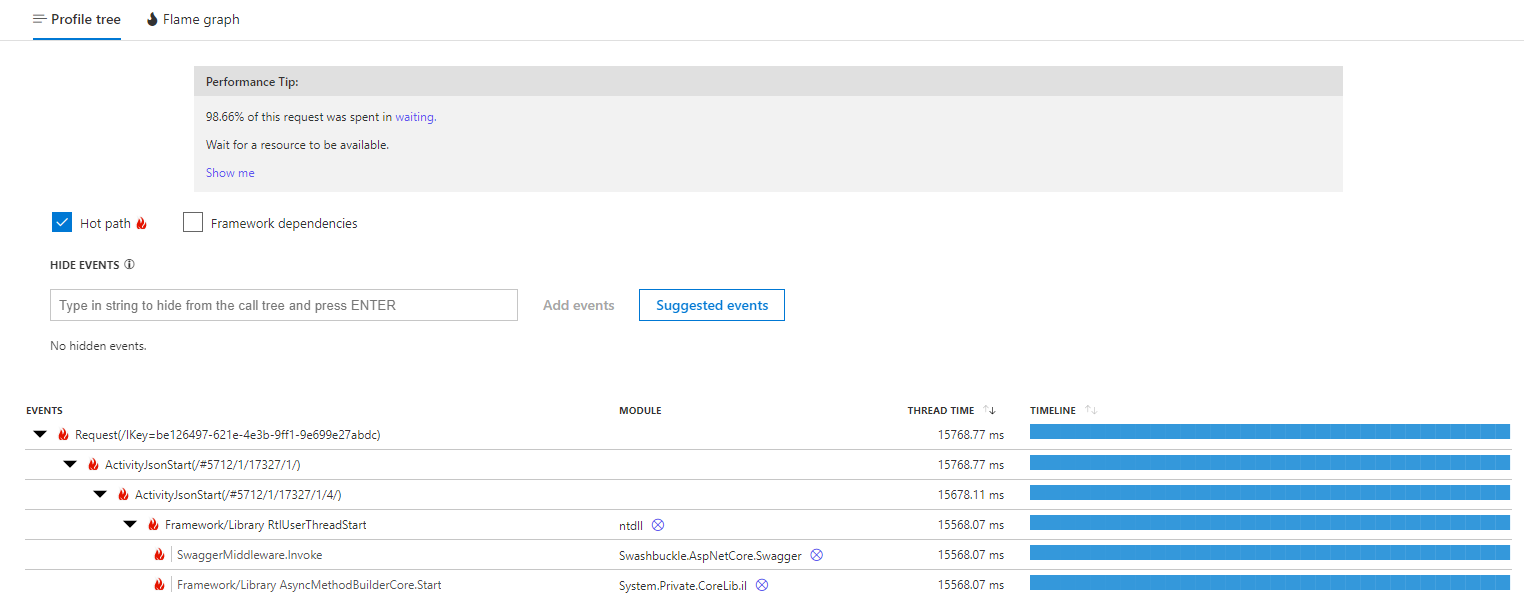
Consequently, we investigate the CPU and configured the CPU Profiler on the Application Insight instance. When we look on the blocking request, we have this message :

We did some CPU profiling
99.78% of this request was spent in waiting.
Wait for a resource to be available.
We do not have webjobs or functions running on the same app service plan
We investigate our reverse proxy (Cloudflare), disabled it, we still have the slow requests
We updated all the nuget package of the .Net app
The Memory Level seems fine (around 50-55%)
The outbound connections is between 50-100 average
