Get Last label on X axis in Line Chart

Kurt 21 Reputation points
2020-10-21T14:28:55.923+00:00

Hello,
I have a line chart with hundreds of values. I have found that using the Interval function to display the labels reduces the count so the labels are where they are supposed to be. I originally set the interval to 30, but the last label on the X-Axis is not shown. I have tried this code in the Interval, but it still is not working.

=IIF(Fields!k2_data_ndx.Value = MAX(Fields!k2_data_ndx.Value, "K2uspDataSet"), 1, 30)  

Is there any way to add the last label to the axis? Would it be possible to add another category group with the last value and show it with the other labels?

Thanks,

34045-image.png

SQL Server Reporting Services
A SQL Server technology that supports the creation, management, and delivery of both traditional, paper-oriented reports and interactive, web-based reports.
2,915 questions
0 comments No comments
{count} votes

1 answer

Sort by: Most helpful
  1. Joyzhao-MSFT 15,576 Reputation points
    2020-10-22T02:22:08.95+00:00

    Hi @Kurt ,
    After setting the axis interval, all automatic labels will be disabled. If you specify a value for the axis interval, you may experience unknowable label behavior, depending on the number of categories on the category axis.
    Check whether the "Hide the first and last labels along this axis" option is selected.
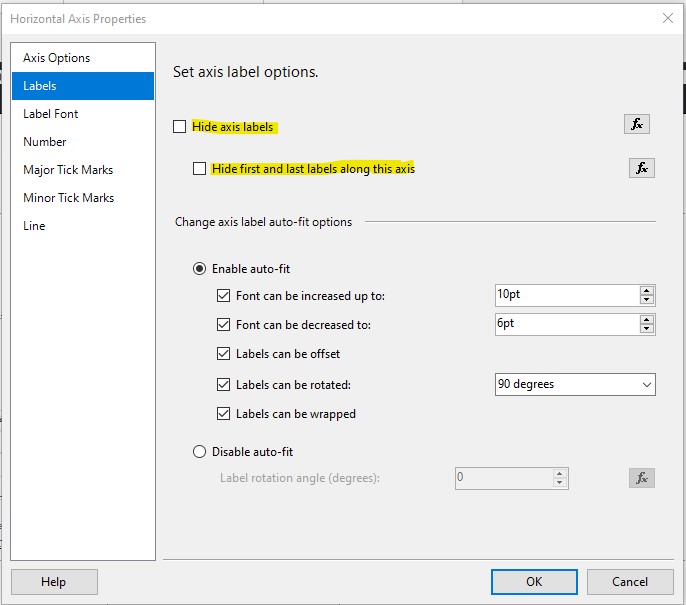
    34158-01.jpg
    Best Regards,
    Joy


    If the answer is helpful, please click "Accept Answer" and upvote it.
    Note: Please follow the steps in our documentation to enable e-mail notifications if you want to receive the related email notification for this thread.

    1 person found this answer helpful.

Your answer

Answers can be marked as Accepted Answers by the question author, which helps users to know the answer solved the author's problem.