SQL Server Reporting Services
A SQL Server technology that supports the creation, management, and delivery of both traditional, paper-oriented reports and interactive, web-based reports.
This browser is no longer supported.
Upgrade to Microsoft Edge to take advantage of the latest features, security updates, and technical support.
' cx='32' cy='32' r='32' /%3E%3Ctext x='50%25' y='55%25' dominant-baseline='middle' text-anchor='middle' fill='%23FFF' %3EK%3C/text%3E%3C/svg%3E)
I have a stored procedure that pulls in data used for a report in SSRS. Please see the attached question that I posted to Stack Overflow here. My issue occurs when I use a field which does not seem to follow the matrix groupings.
My sample data:
    CREATE TABLE Table1
        ([period] int, [state] varchar(2), [company] varchar(8), [rate] numeric, [rate_num] numeric, [rate_denom] numeric)
    ;
/*
-- Alternate option

CREATE TABLE Table1
    ([period] int, [state] varchar(2), [company] varchar(8), [rate] DECIMAL(7,6), [rate_num] DECIMAL(7,2), [rate_denom] DECIMAL(10,2))
;
*/

    INSERT INTO Table1
        ([period], [state], [company], [rate], [rate_num], [rate_denom])
    VALUES
        (202004, 'ST', 'Company1', 0.000497, NULL, 10562.51),
        (202004, 'ST', 'Company1', 0.000497, 50, 6984.57),
        (202004, 'ST', 'Company1', 0.000497, 100, 223199.73),
        (202004, 'ST', 'Company1', 0.000497, NULL, 60627.17),
        (202005, 'ST', 'Company1', NULL, NULL, 4291.98),
        (202005, 'ST', 'Company1', NULL, NULL, 420617.49),
        (202005, 'ST', 'Company1', NULL, NULL, 49403.02),
        (202005, 'ST', 'Company1', NULL, NULL, 64282.61),
        (202005, 'ST', 'Company2', NULL, NULL, 2287.94),
        (202005, 'ST', 'Company2', NULL, NULL, 63990.73),
        (202005, 'ST', 'Company2', NULL, NULL, 455426.94),
        (202006, 'ST', 'Company2', 0, NULL, 3000.9),
        (202006, 'ST', 'Company2', 0, NULL, 2000.61),
        (202006, 'ST', 'Company2', 0, 0, 60000),
        (202007, 'ST', 'Company2', 0.000131, NULL, 11434.4),
        (202007, 'ST', 'Company2', 0.000131, NULL, 2347.94),
        (202007, 'ST', 'Company2', 0.000131, 97.5, 727027.39)
    ;
I have the rate field which I calculated in SQL. Rate_calc is an expression to calculate the rate in SSRS via the values I used to calculate the rate in SQL. I am using the following code for my matrix table data:
-- Rate_calc
=IIF(Sum(Fields!rate_denom.Value) <= 0, "", Sum(Fields!rate_num.Value) / Sum(Fields!rate_denom.Value))

-- Rate
=IIF(IsNothing(Fields!rate.Value), "", Fields!rate.Value)
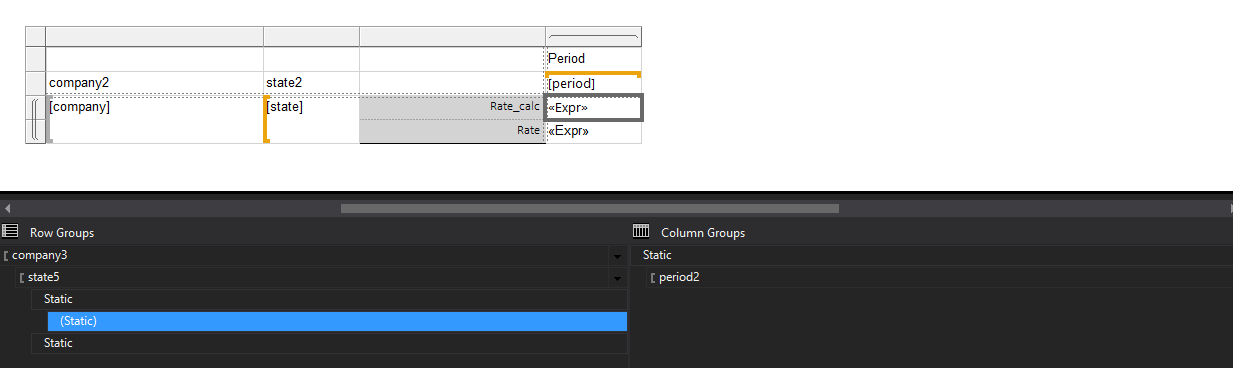
My matrix groupings:
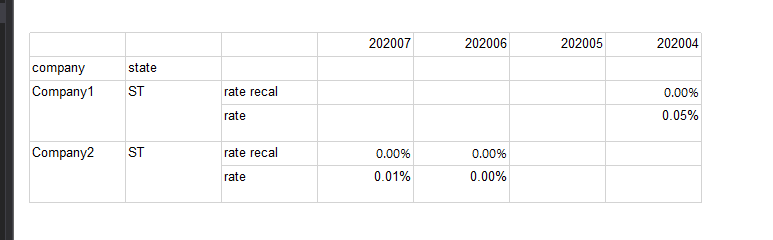
I get the output below which also contains my expected output. When using rate it seems to bypass the grouping and fill the rows which are specific to each individual company. For example 202004 only had data for Company1 but the same info shows for Company2. Neither company had data in 202005 and only Company2 had data in the remaining periods.
To clarify, my expected output only needs 1 rate calculation. I would prefer it use the rate field since I don't need to display the same information twice.
-- Output

+----------+-------+-----------+--------+--------+--------+--------+
| Company  | State |           | 202007 | 202006 | 202005 | 202004 |
+----------+-------+-----------+--------+--------+--------+--------+
| Company1 | ST    | Rate_Calc |        |        | 0.00%  | 0.05%  |
|          |       | Rate      | 0.01%  | 0.00%  |        | 0.05%  |
| Company2 | ST    | Rate_Calc | 0.01%  | 0.00%  | 0.00%  |        |
|          |       | Rate      | 0.01%  | 0.00%  |        | 0.05%  |
+----------+-------+-----------+--------+--------+--------+--------+


-- Expected

+----------+-------+----------+--------+--------+--------+--------+
| Company  | State |          | 202007 | 202006 | 202005 | 202004 |
+----------+-------+----------+--------+--------+--------+--------+
| Company1 | ST    | Expected |        |        |        | 0.05%  |
| Company2 | ST    | Expected | 0.01%  | 0.00%  |        |        |
+----------+-------+----------+--------+--------+--------+--------+
Am I using the rate field wrong? Otherwise I could try and use IsNothing but sometimes I need to SUM values for a period which may also contain a null value. Any suggestions on achieving the expected output are appreciated.
Finally, the SO post may provide this in a better format -- sorry if it does not format properly here this is my first post on this forum.
' cx='32' cy='32' r='32' /%3E%3Ctext x='50%25' y='55%25' dominant-baseline='middle' text-anchor='middle' fill='%23FFF' %3ELY%3C/text%3E%3C/svg%3E)
Hi,
Did not hear from you , did you resolve this issue ?
This did not resolve my issue. I confirmed by CASTing manually the data was in decimal format and still did not resolve. However, I rebuilt several matrices that had a similar issue and they worked with the same structure.
Not sure where the problem was but thanks for trying.
This has to be something with the design, just we have not noticed which part exactly. Maybe some small setting somewhere.
Yes, I agree. Thanks again for your assistance. I thought it was odd since the groupings were the exact same. I'm not sure what else would have been causing it but as you mentioned there must have been an issue in the settings somewhere to cause this disconnect.
Hi,
Your design page is not quite the same as your out put. And your out put is not correspond to you expected result. So, this is not easy for outsiders to understand your structure and issue.
But I made one test with your sample data and expression. And I got seemly correct outcome.
This is my design you could understand the grouping by the yellow and grey square bracket.
Not sure if your design or raw data has issue. I cast the rate from string to decimal in the dataset query.
I changed a bit in the expression :
Rate_ Recal   =IIF(IsNothing(Fields!rate.Value) And IsNothing(Fields!rate_num.Value),"",IIF(Sum(Fields!rate_denom.Value) <= 0, "", Sum(IIF(IsNothing(Fields!rate_num.Value),Fields!rate_num.Value,0)) / Sum(Fields!rate_denom.Value)))
Rate    =IIF(IsNothing(Fields!rate.Value), " ", Fields!rate.Value)
Hope this could help.
Regards,
Lukas
If the answer is helpful, please click "Accept Answer" and upvote it.
Note: Please follow the steps in our documentation to enable e-mail notifications if you want to receive the related email notification for this thread.
Lukas,
Thanks for your assistance with this issue.
You were correct, when I copied the data from an Excel file to a SQL Fiddle I didn't realize that some numeric data came in as a string. I updated the data to reflect that.
To clarify, my expected output is the desired output, ideally using the rate field which your expression was similar to mine. I also added an updated image to reflect the actual field names discussed.
rate_num and rate_denom represent the actual values used to calculate the rate field. I do not need two rows representing the same data. I was providing them both to show my output from different tests.
Can you expand on your groupings? I'm confused why there appears to be a grouping on rate_recal and what appears to be a double column grouping on period. I am more interested in the double column grouping since ideally I don't need to calculate rate via an expression if the field works.
Hi,
Sure.
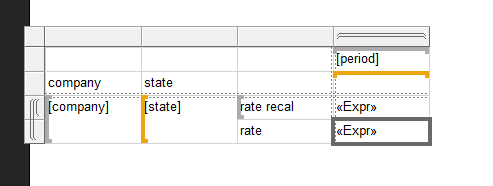
There could be no double grouping. It was just my hasty design that I add group directly on the pre-exist matrix group. I could delete them and this makes no change to the result. I have modify the design. So now it looks quite like yours : 
And the test result hasn't change. So I omit the screenshot.
I think your design is OK on this.