Hello all,
this is what i figured out so far :
there is not simple way to change to column colors with in azure insight logs.
(located in : portal -> application insight -> click application insight name -> click Logs )
the alternative way that was suggested by SwathiDhanwada-MSFT is to use Workbooks
(located in : portal -> application insight -> click application insight name -> click Workbooks )
then click on the Empty (colored green) tile -> click +Add and add a query -> paste/ write your logs query and run it once.
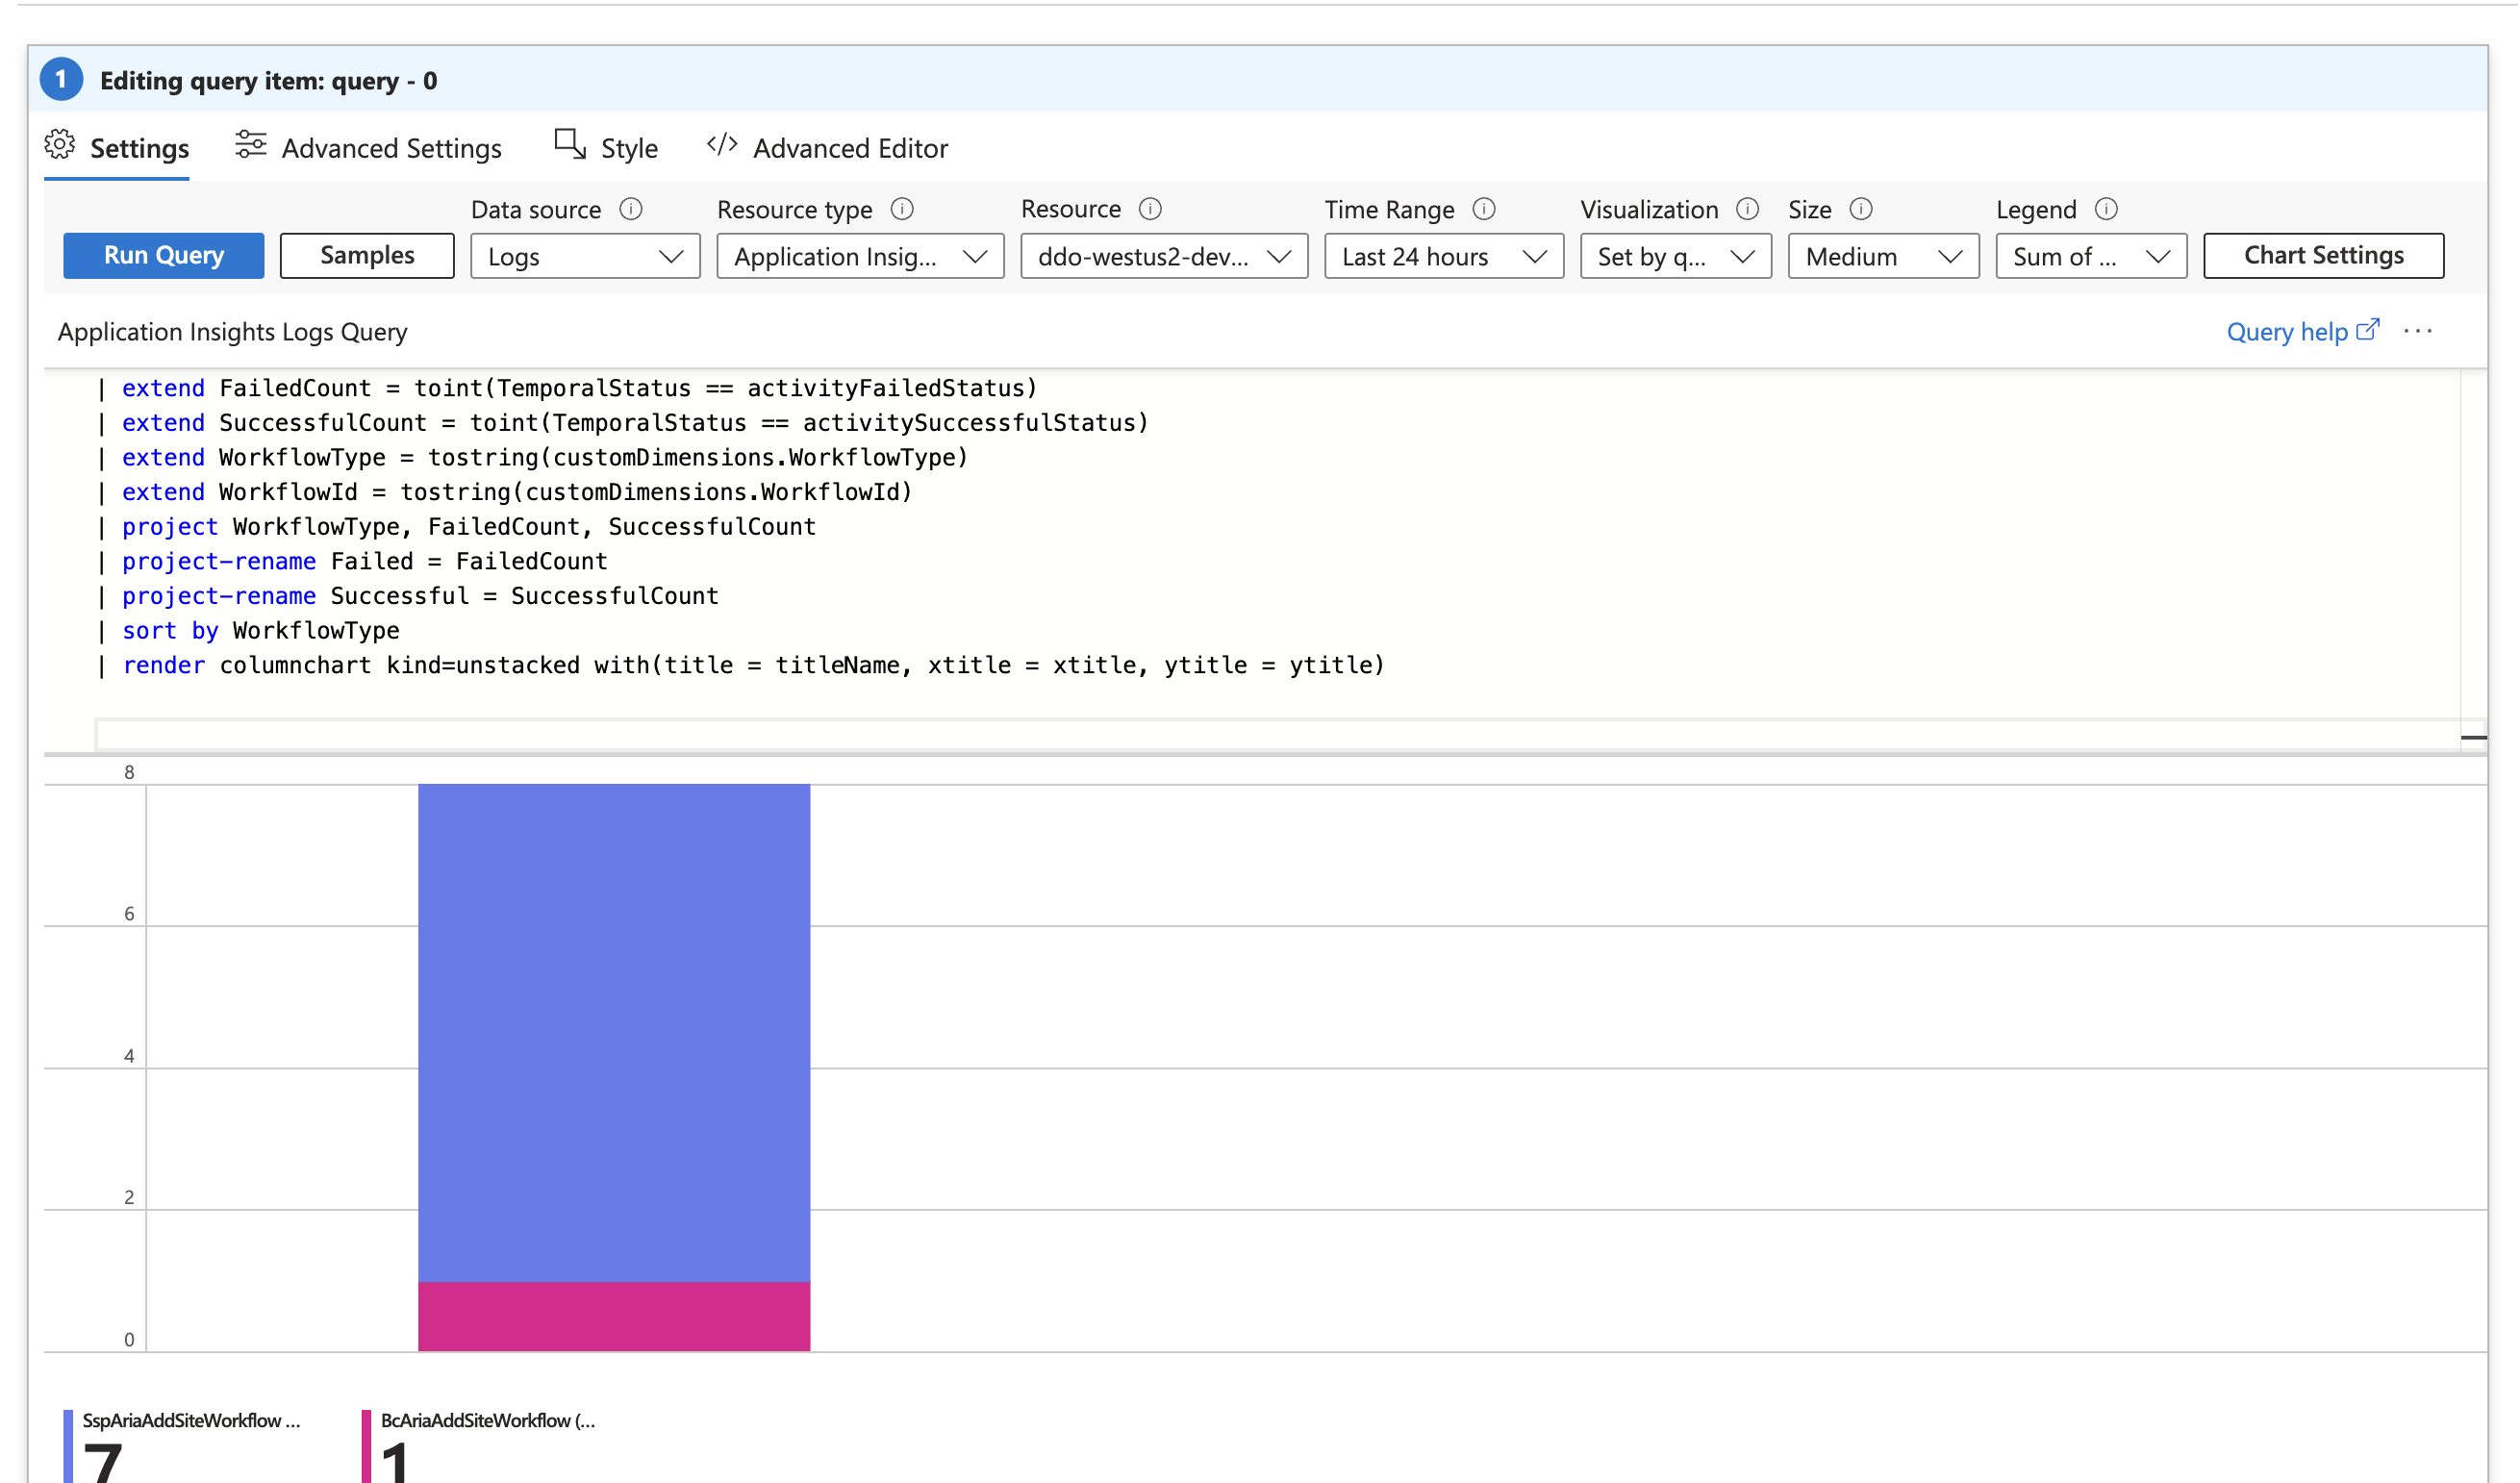
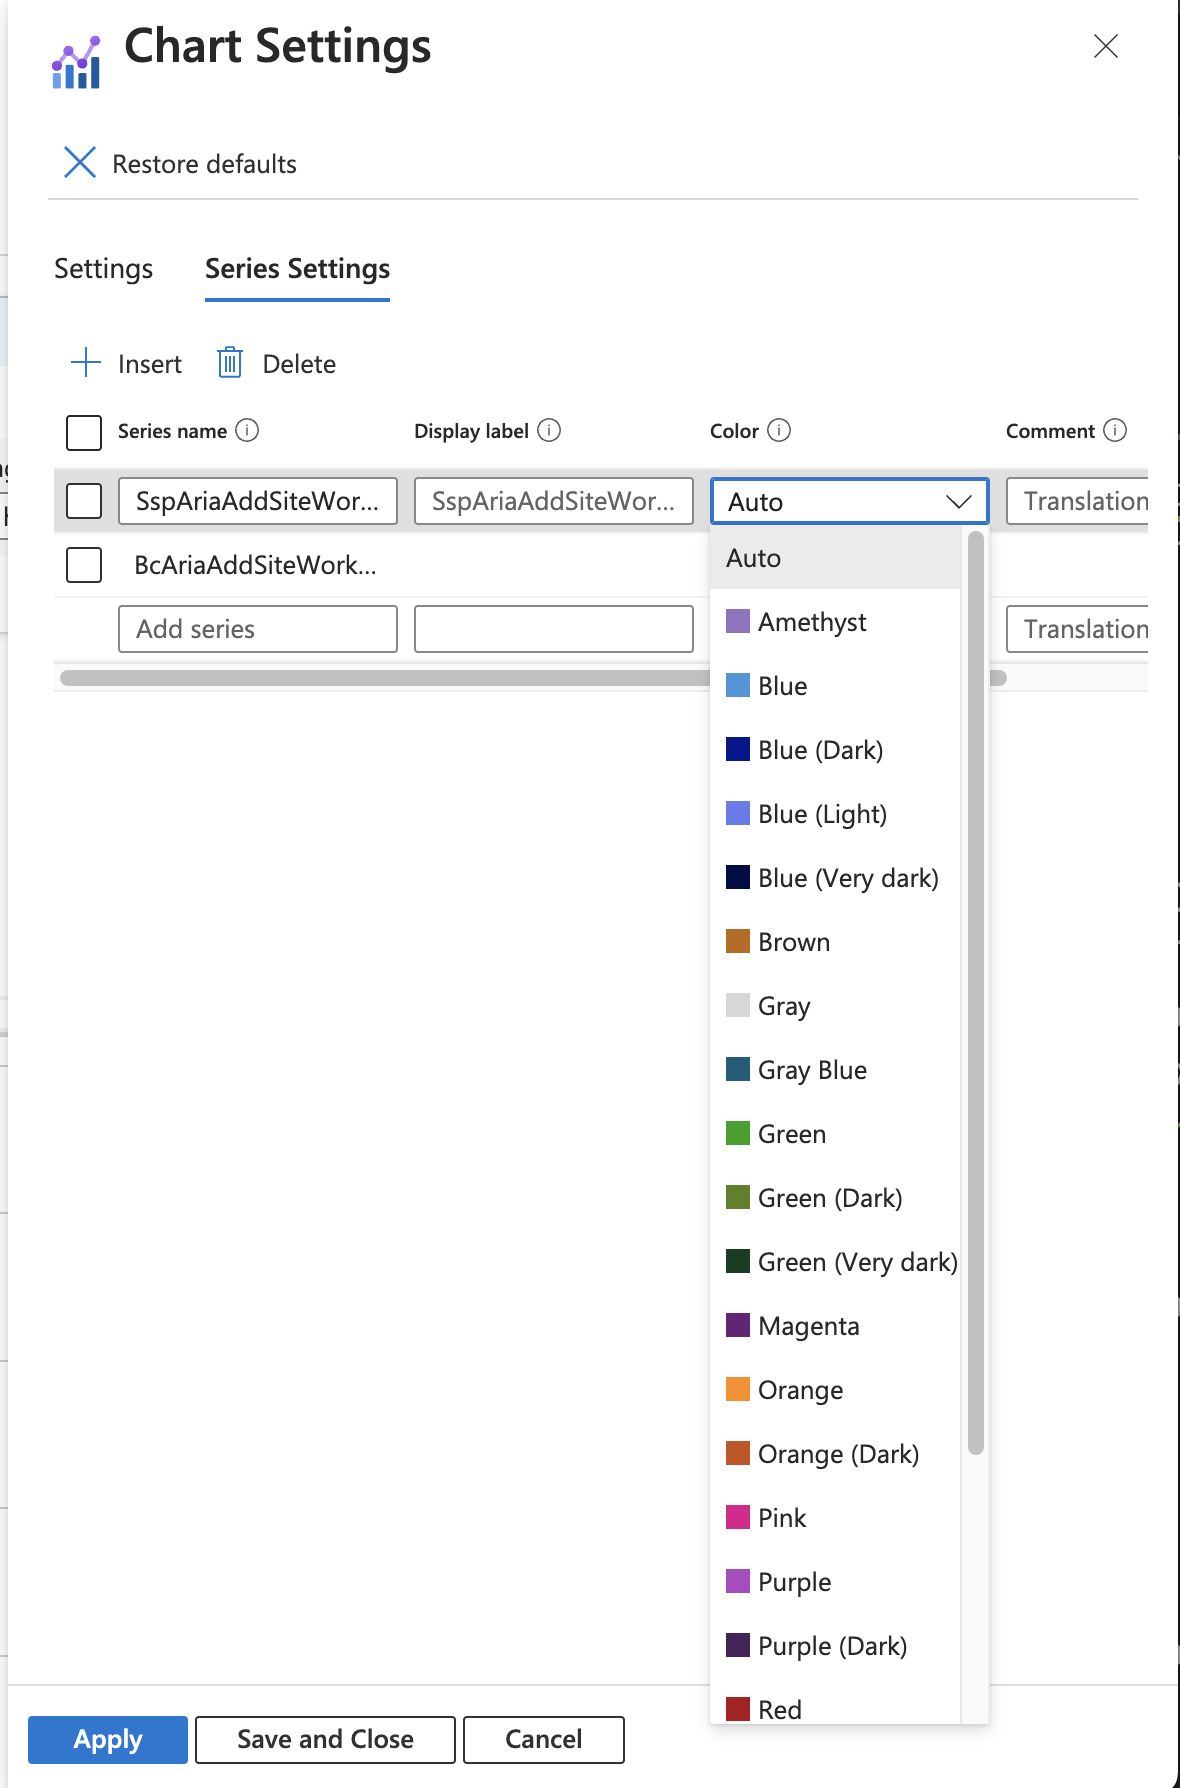
then -> click on "chart settings" on the upper right side -> click Series Settings -> click on the color option and change the color for your required color. - see picture below.
Importent Notes :
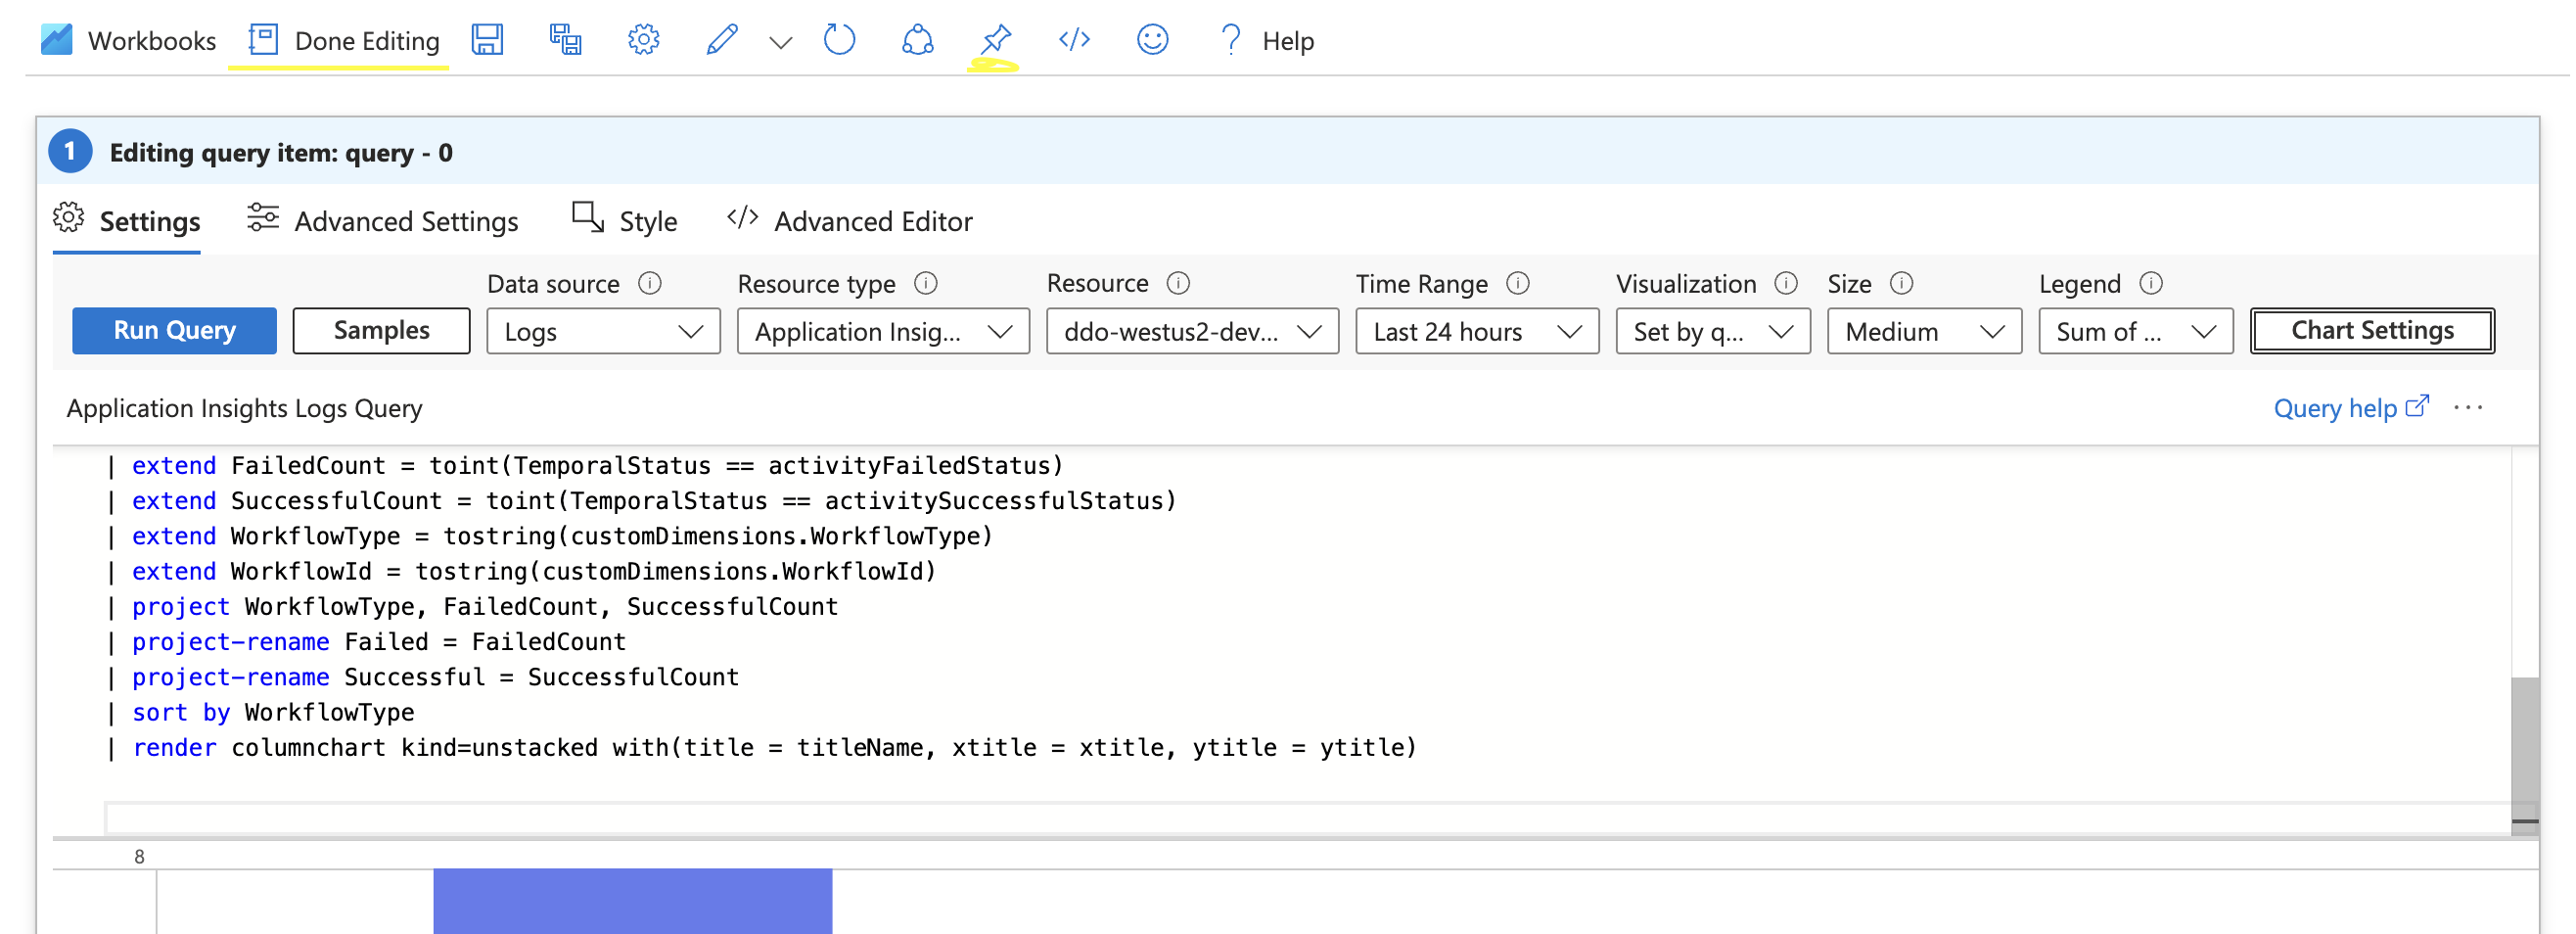
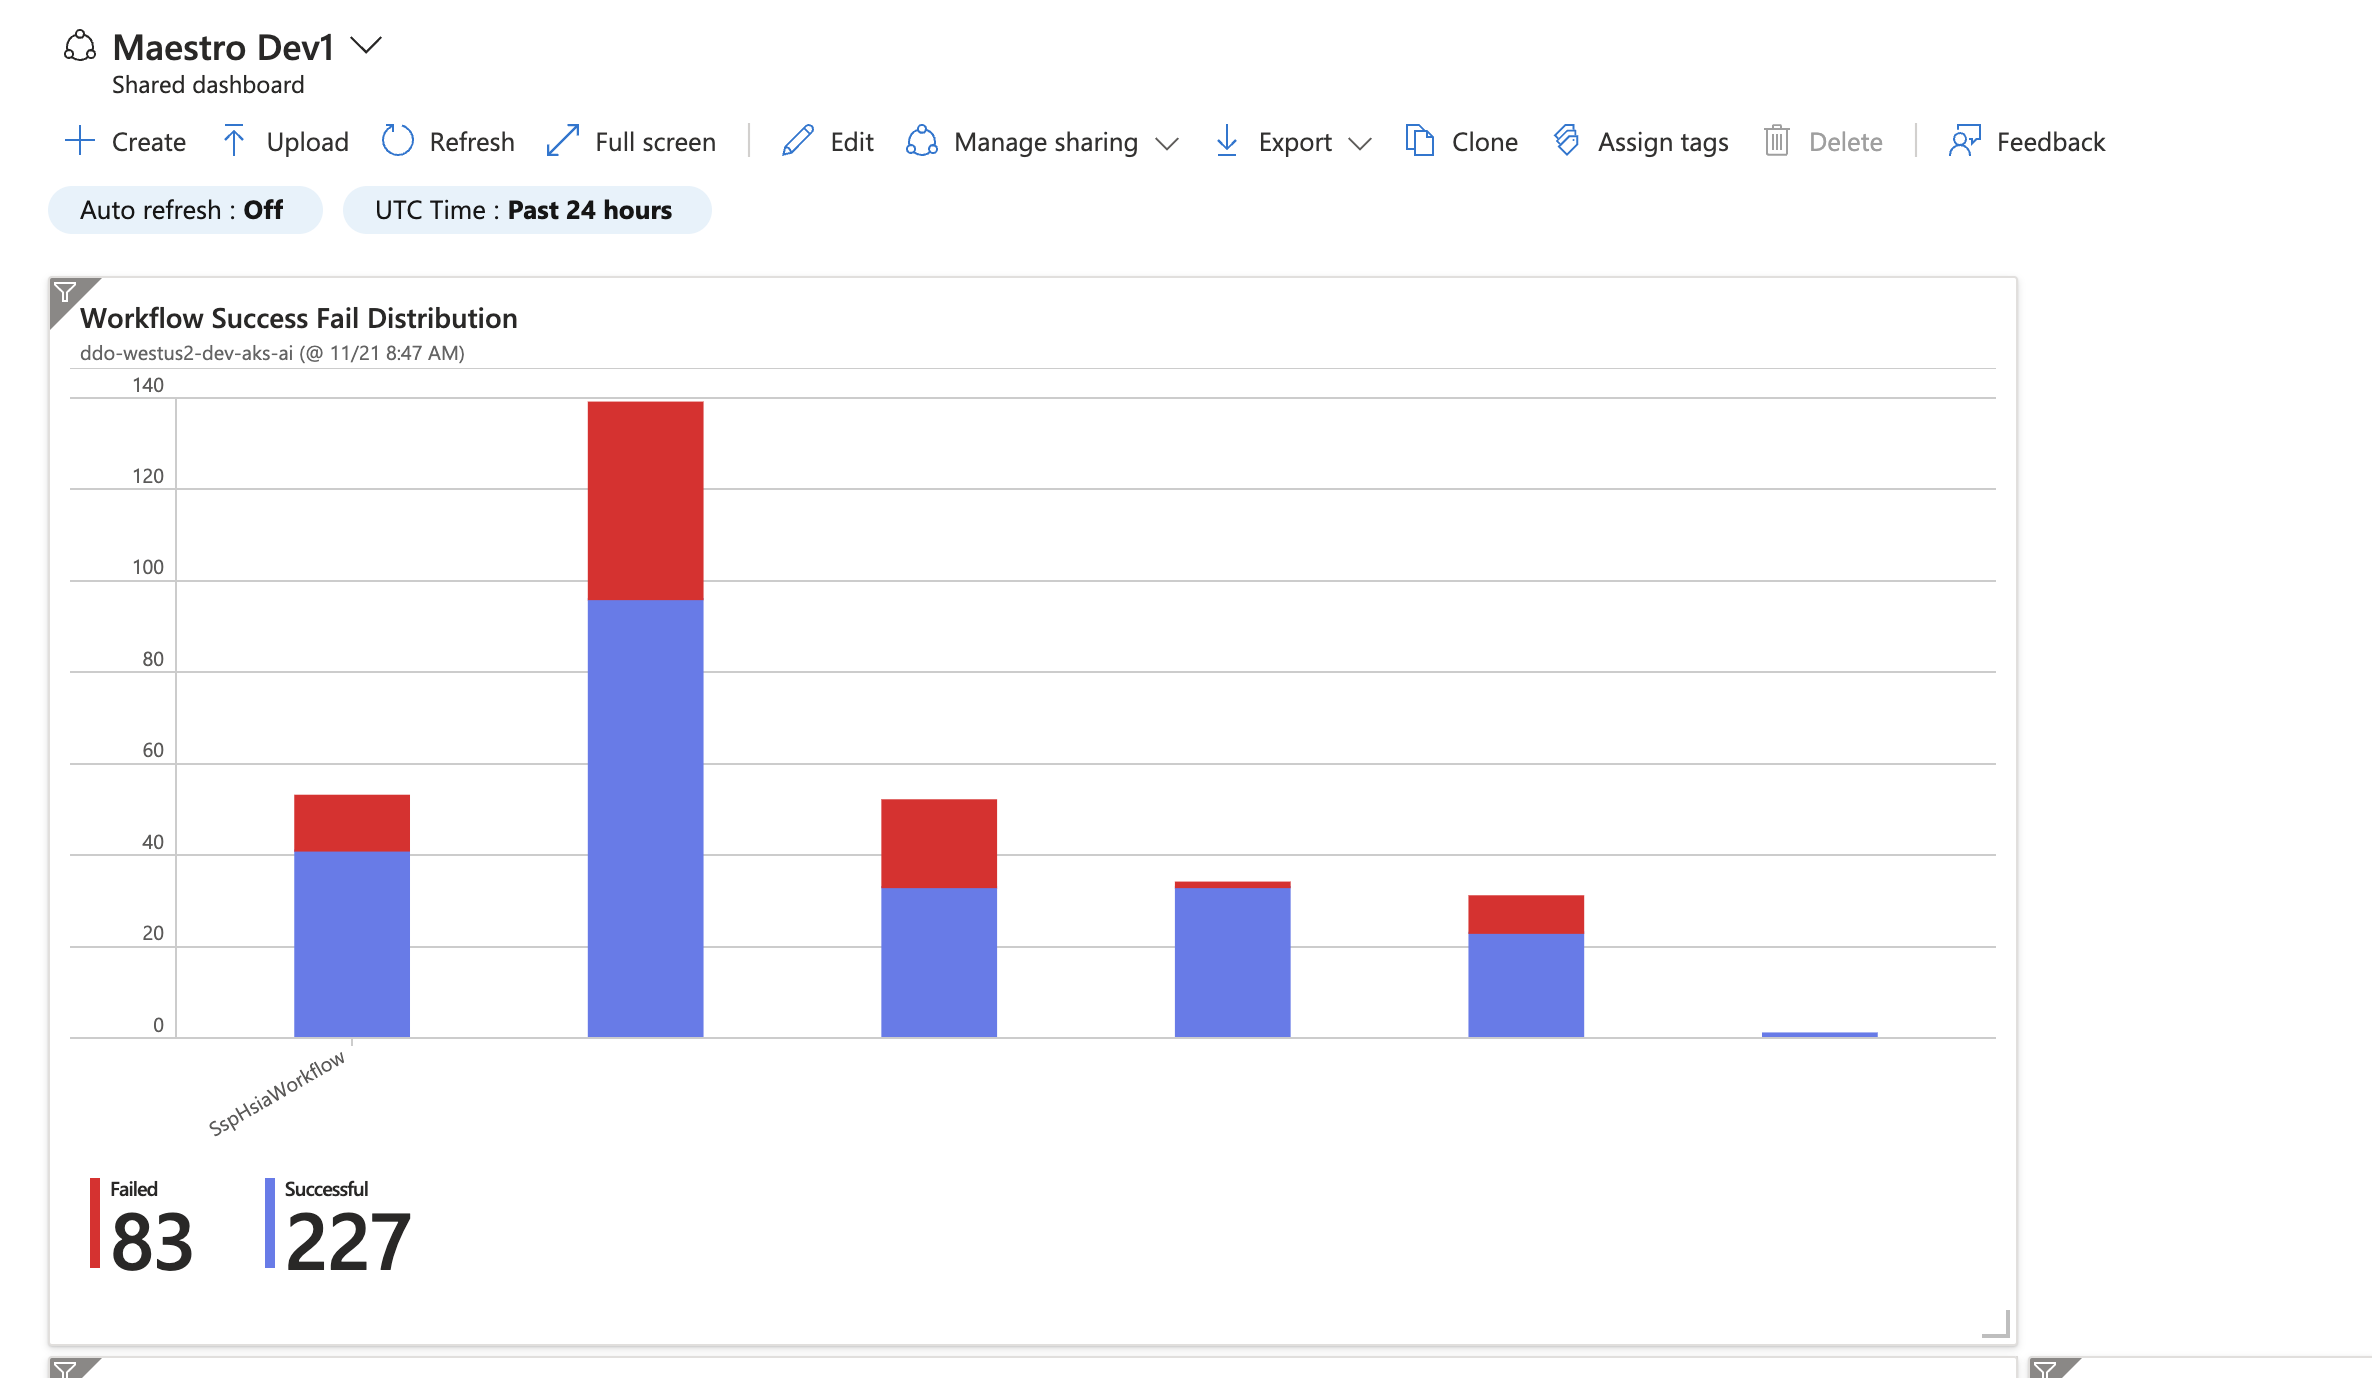
- if you want to "pin" the chart to your dashboard -> after running the query at least once and without clicking on "Done Editing" -> you can click on "pin" icon and pin it to your dashboard (see picture below)
if you'll try to pin the chart to dashboard after clicking done editing - you will the the workbook tile in the dashboard instead of the chart.
- limitation i encounter -> after pining the chart to the dashboard - > opening the dashboard -> changing the. refresh of dashboard -> it will not inflate the workbook charts .
last thing that is unclear to me is :
when i try create a workbook with log analytics parameters :
I get error (see below) but when I ran it in the Logs (log analytics) it's working fine
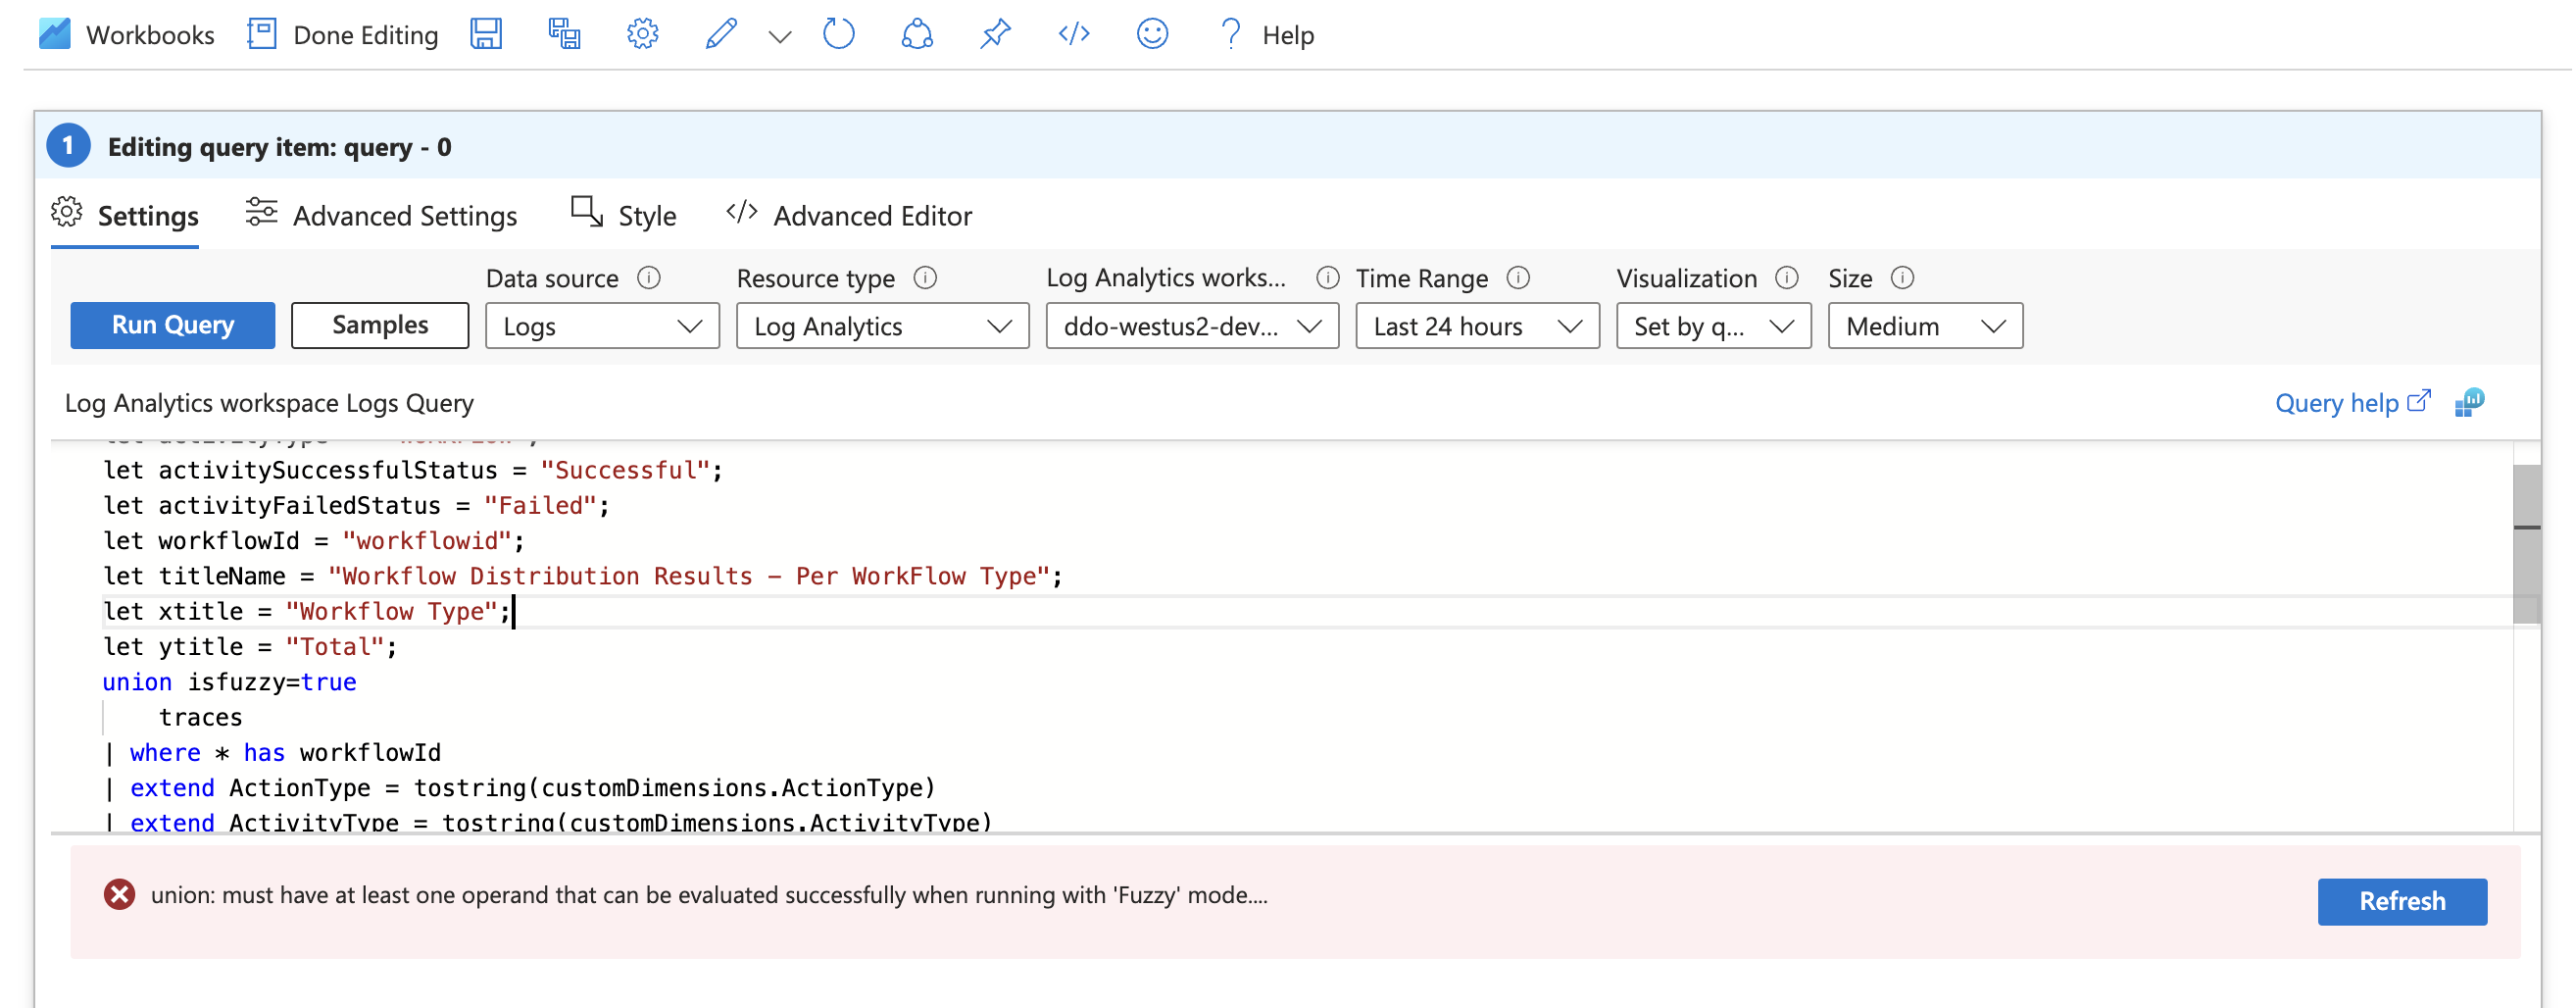
I hope I helped someone ,
I hope to understand better the different behaviour with in log analytics and workbook .
