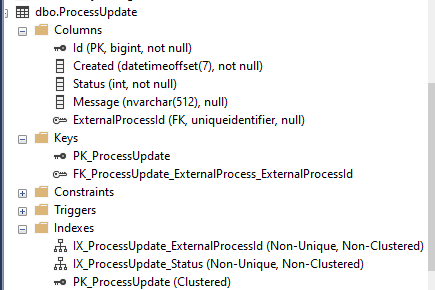
I am having a heck of a time learning SQL performance guidance and need some help. My application has been growing over the past year and one table in particular has grown to over 590K rows. Here is it's schema:

It's a very simple table and I have been struggling recently with Sql Server initialization around this table whenever it scans the keys, where queries will take anywhere up to 2:30 minutes to scan them all. I have another thread where I discuss this that started this whole rabbit hole for me as I was receiving Timeout exceptions when my application initialized and also randomly during operation.
Anyway, back to my current plight. I ended up making a view that helped reduce the time down from minutes to seconds:
CREATE VIEW [dbo].[View_ExternalProcess_Properties] AS
SELECT pu.ExternalProcessId AS Id, pu.Created, pu.[Status], pu.[Message] FROM ProcessUpdate pu
WHERE ID = (SELECT TOP(1) Id FROM ProcessUpdate p2 WHERE p2.ExternalProcessId = pu.ExternalProcessId ORDER BY Id DESC)
I thought this solved my problem but after running my application I landed on another problem that I will attempt to demonstrate with a few queries. Here is this first:
CHECKPOINT;
GO
DBCC DROPCLEANBUFFERS;
GO
DBCC FREEPROCCACHE;
SELECT CASE
    WHEN EXISTS (
        SELECT 1
        FROM ExternalProcess e JOIN [View_ExternalProcess_Properties] p ON p.Id = e.Id
        WHERE [e].[Discriminator] = N'IssuanceProcess' AND [p].[Status] = 4) THEN CAST(1 AS bit)
    ELSE CAST(0 AS bit)
END
Notice the [Status] = 4 . When I run this on my Azure Sql S1 server, this executes in 4 seconds. That is very acceptable to me. However, if I change this query to:
CHECKPOINT;
GO
DBCC DROPCLEANBUFFERS;
GO
DBCC FREEPROCCACHE;
SELECT CASE
    WHEN EXISTS (
        SELECT 1
        FROM ExternalProcess e JOIN [View_ExternalProcess_Properties] p ON e.Id = p.Id
        WHERE [e].[Discriminator] = N'IssuanceProcess' AND [p].[Status] = 6) THEN CAST(1 AS bit)
    ELSE CAST(0 AS bit)
END
(Basically, changing the Status from 4 to 6)
This takes 12 seconds to complete, or 3-times longer than when Status is 4.
My concern is that as I add more rows to this table the startup time will only increase as the scan would have to scan more rows (I would like confirmation on this if possible) and it's only a matter of time before I potentially get timeouts again in my application because it's taking so long to scan these rows.
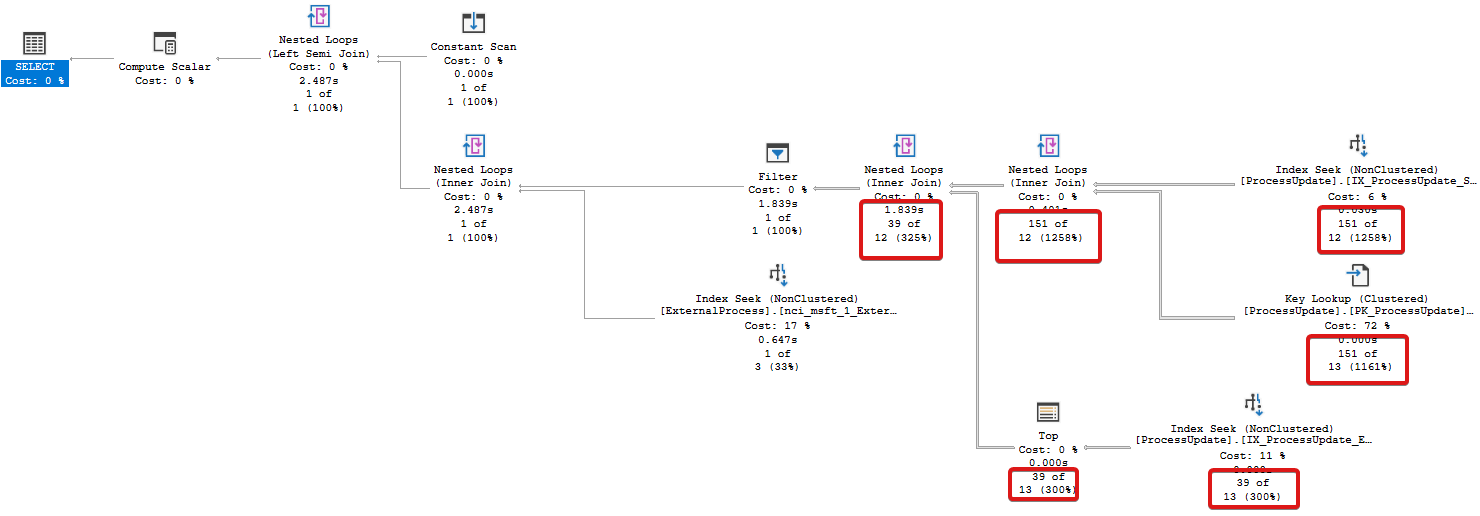
Outside of this, I have taken the time to review the execution plans for the above queries and they are confusing to me. Here is the Status = 4 :

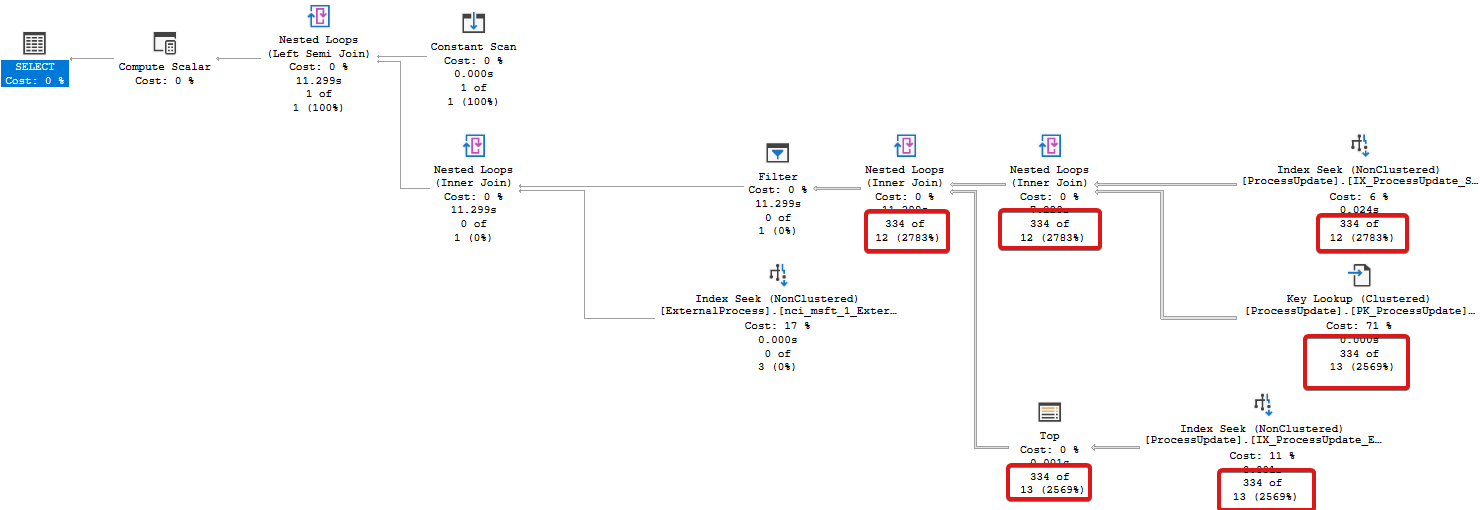
And the Status = 6 :

I've outlined in red rectangles the areas that concern me. It appears there are more rows than expected, if I understand correctly, and leading to values higher than 100% for total rows processed. Additionally, for the Status = 6, there are more of these rows which seem to be the reason why it's taking longer.
I would great appreciate any assistance in alleviating my confusion in learning how to properly diagnose these performance issues.
Thank you for any assistance you can provide.

