I have come across an issue and have yet to find a "fix" for the error. While debugging and ASP.NET application using C# an error occurs about "The target process exited with code -2147023895 while evaluating the function..." 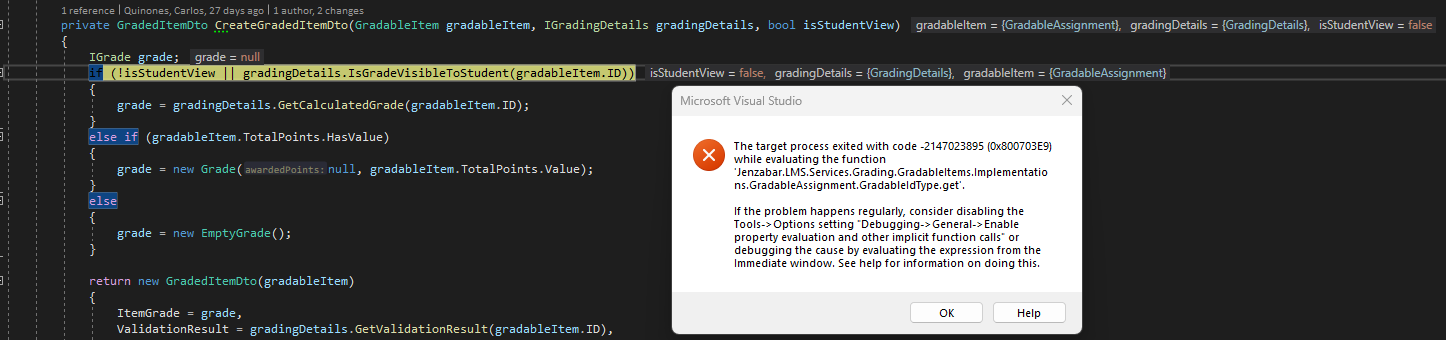
Microsoft's suggestion of disabling the property evaluation and other implicit function calls means that I can no longer properly debug. I disabled all extension to see if that helped but it did not. I "Repaired" VS using the VS installer and have also uninstalled VS 2019 and VS 2022 twice now and I am still seeing the same exact issue. I even deleted all traces of VS and created new repos to work form. Within the group of developers I work with I am the only one with this issue using the same exact code. Are there any other configurations that may be causing this issue? This is quite frustrating. I had also updated to the latest for Visual Studio as well as the Operating System. Here is the Info for my setup...
Microsoft Visual Studio Enterprise 2019
Version 16.11.35
VisualStudio.16.Release/16.11.35+34729.46
Microsoft .NET Framework
Version 4.8.09032
Installed Version: Enterprise
Visual C++ 2019 00435-60000-00000-AA451
Microsoft Visual C++ 2019
.NET Core Debugging with WSL 1.0
.NET Core Debugging with WSL
ASP.NET and Web Tools 2019 16.11.119.57942
ASP.NET and Web Tools 2019
ASP.NET Web Frameworks and Tools 2019 16.11.119.57942
For additional information, visit https://www.asp.net/
Azure App Service Tools v3.0.0 16.11.119.57942
Azure App Service Tools v3.0.0
Azure Functions and Web Jobs Tools 16.11.119.57942
Azure Functions and Web Jobs Tools
C# Tools 3.11.0-4.22108.8+d9bef045c4362fbcab27ef35daec4e95c8ff47e1
C# components used in the IDE. Depending on your project type and settings, a different version of the compiler may be used.
Common Azure Tools 1.10
Provides common services for use by Azure Mobile Services and Microsoft Azure Tools.
IntelliCode Extension 1.0
IntelliCode Visual Studio Extension Detailed Info
JetBrains ReSharper 2024.1.1 Build 241.0.20240415.221055
JetBrains ReSharper package for Microsoft Visual Studio. For more information about ReSharper, visit http://www.jetbrains.com/resharper. Copyright © 2024 JetBrains, Inc.
Microsoft Azure Tools for Visual Studio 2.9
Support for Azure Cloud Services projects
Microsoft Continuous Delivery Tools for Visual Studio 0.4
Simplifying the configuration of Azure DevOps pipelines from within the Visual Studio IDE.
Microsoft JVM Debugger 1.0
Provides support for connecting the Visual Studio debugger to JDWP compatible Java Virtual Machines
Microsoft Library Manager 2.1.126+g11d4cf0d0c.RR
Install client-side libraries easily to any web project
Microsoft MI-Based Debugger 1.0
Provides support for connecting Visual Studio to MI compatible debuggers
Microsoft Visual C++ Wizards 1.0
Microsoft Visual C++ Wizards
Microsoft Visual Studio Tools for Containers 1.2
Develop, run, validate your ASP.NET Core applications in the target environment. F5 your application directly into a container with debugging, or CTRL + F5 to edit & refresh your app without having to rebuild the container.
Microsoft Visual Studio VC Package 1.0
Microsoft Visual Studio VC Package
NuGet Package Manager 5.11.5
NuGet Package Manager in Visual Studio. For more information about NuGet, visit https://docs.nuget.org/
ProjectServicesPackage Extension 1.0
ProjectServicesPackage Visual Studio Extension Detailed Info
Razor (ASP.NET Core) 16.1.0.2122504+13c05c96ea6bdbe550bd88b0bf6cdddf8cde1725
Provides languages services for ASP.NET Core Razor.
Snapshot Debugging Extension 1.0
Snapshot Debugging Visual Studio Extension Detailed Info
SQL Server Data Tools 16.0.62205.05200
Microsoft SQL Server Data Tools
Test Adapter for Boost.Test 1.0
Enables Visual Studio's testing tools with unit tests written for Boost.Test. The use terms and Third Party Notices are available in the extension installation directory.
Test Adapter for Google Test 1.0
Enables Visual Studio's testing tools with unit tests written for Google Test. The use terms and Third Party Notices are available in the extension installation directory.
TypeScript Tools 16.0.30526.2002
TypeScript Tools for Microsoft Visual Studio
Visual Basic Tools 3.11.0-4.22108.8+d9bef045c4362fbcab27ef35daec4e95c8ff47e1
Visual Basic components used in the IDE. Depending on your project type and settings, a different version of the compiler may be used.
Visual F# Tools 16.11.0-beta.21514.6+b6c2c4f53ea3a08fa603ea93d6d2f808a62a21d1
Microsoft Visual F# Tools
Visual Studio Code Debug Adapter Host Package 1.0
Interop layer for hosting Visual Studio Code debug adapters in Visual Studio
Visual Studio Container Tools Extensions 1.0
View, manage, and diagnose containers within Visual Studio.
Visual Studio Tools for CMake 1.0
Visual Studio Tools for CMake
Visual Studio Tools for Containers 1.0
Visual Studio Tools for Containers
' cx='32' cy='32' r='32' /%3E%3Ctext x='50%25' y='55%25' dominant-baseline='middle' text-anchor='middle' fill='%23FFF' %3EQC%3C/text%3E%3C/svg%3E)
' cx='32' cy='32' r='32' /%3E%3Ctext x='50%25' y='55%25' dominant-baseline='middle' text-anchor='middle' fill='%23FFF' %3ETS%3C/text%3E%3C/svg%3E)