why is MEMORYCLERK_SQLGENERAL using so much memory in SQL Server?

Will Garner 11 Reputation points
2020-11-19T01:25:01.317+00:00

I have a production system running SQL Server 2019 Standard edition. It recently had a problem 3 times in 1 day where it became unresponsive until a reboot. Errors seem to point to memory limitations. 32GB is installed and the machine is dedicated to MSSQL. Max Memory set to 26GB.

The best lead I have so far is output of dbcc memorystatus that was automatically dumped to the log along with a FAIL_PAGE_ALLOCATION error. The full output is atttached, but this part below caught my eye. It looks like MEMORYCLERK_SQLGENERAL wanted so much memory that it forced normal things like the buffer pool and query memory down to uselessly small levels.
40942-postmortem-sql-log-dbcconly-2020-11-18.txt

I can't seem to find any good info on what MEMORYCLERK_SQLGENERAL does, let alone why it would want so much memory.

11/18/2020 15:10:48,spid51,Unknown,MEMORYCLERK_SQLGENERAL (node 0)                  KB  
Pages Allocated                            22821672  
SM Committed                                      0  
SM Reserved                                       0  
Locked Pages Allocated                       546740  
VM Committed                                  75776  
VM Reserved                                12867644  
---------------------------------------- ----------  
11/18/2020 15:10:48,spid51,Unknown,MEMORYCLERK_SQLBUFFERPOOL (node 0)               KB  
Pages Allocated                                3400  
SM Committed                                      0  
SM Reserved                                       0  
Locked Pages Allocated                            0  
VM Committed                                      0  
VM Reserved                                       0  
---------------------------------------- ----------  
11/18/2020 15:10:48,spid51,Unknown,MEMORYCLERK_SQLQUERYPLAN (node 0)                KB  
Pages Allocated                                3632  
SM Committed                                      0  
SM Reserved                                       0  
Locked Pages Allocated                            0  
VM Committed                                      0  
VM Reserved                                       0  
---------------------------------------- ----------  
11/18/2020 15:10:48,spid51,Unknown,MEMORYCLERK_SQLQUERYEXEC (node 0)                KB  
Pages Allocated                                1128  
SM Committed                                      0  
SM Reserved                                       0  
Locked Pages Allocated                            0  
VM Committed                                      0  
VM Reserved                                       0  

Update 2020-11-22: The problem has reoccurred on the new larger instance. The memory errors began a few minutes after a scheduled backup of several databases. That may or may not be coincidence. It became nonresponsive and I forcibly restarted it.
I have posted more information on Stack Exchange, which has been more active:
https://dba.stackexchange.com/questions/279941/why-is-memoryclerk-sqlgeneral-using-so-much-memory-in-sql-server

SQL Server Other
{count} votes

3 answers

Sort by: Most helpful
  1. Shashank Singh 6,251 Reputation points
    2020-11-19T11:43:03.503+00:00

    I do not see any message in errorlog which is threatening. What I have noticed is

    Process virtual memory low 0
    Process physical memory low 0
    System physical memory low 0
    System physical memory high 1

    So neither it points to low physical nor low virtual memory.

    Also Available Physical Memory 3446849536 == 3.1 GB Still I am not sure why you got OOM error.

    You also have Locked pages in memory privilege so something paging out SQL Server vigorously is not possible. Do you see any message like significant part of sql server memory has been paged out ?

    Yes SQLGENERAL clerk is using lot of memory but I don't know what component is using memory. SQLGENERAL is for other general purpose memory allocation. To add to my surprise the buffer pool which should be largest consumer of memory is using very less. I am trying to find out what could be the cause of such scenario.

    Microsoft SQL Server 2019 (RTM-CU6) (KB4563110) - 15.0.4053.23 (X64) Jul 25 2020 11:26:55

    >

    You are still on SQL Server 2019 Cu6, may i suggest you to apply CU8 and let me know if their is any relief.

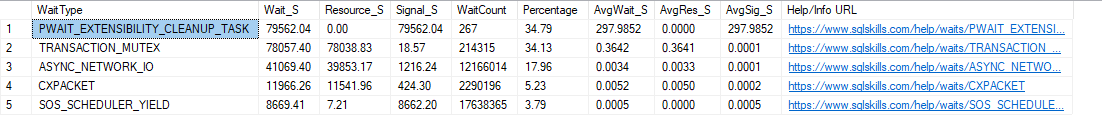
    Can you let me know top waits using query mentioned in this blog

    Also please check AWS document about any such issue.

    0 comments No comments

  2. Will Garner 11 Reputation points
    2020-11-19T21:42:03.707+00:00

    I'll update to CU8 in my next maintenance window. I'm afraid since the server is healthy now on the new instance, current diagnostics don't say much. But I'm not thrilled about going back just to try it out. These waits seem reasonable to me. The TRANSACTION_MUTEX is almost certainly from normal MARS queries and not a problem.
    41000-image.png


  3. m 4,276 Reputation points
    2020-11-20T07:35:19.453+00:00

    Hi @Will Garner ,

    Now @Shashank Singh is following up your issue, if your issue is solved, you can accept his reply as Answer.

    BR,
    Mia


    If the answer is helpful, please click "Accept Answer" and upvote it.

    0 comments No comments

Your answer

Answers can be marked as Accepted Answers by the question author, which helps users to know the answer solved the author's problem.