Azure App Service
Azure App Service is a service used to create and deploy scalable, mission-critical web apps.
7,408 questions
This browser is no longer supported.
Upgrade to Microsoft Edge to take advantage of the latest features, security updates, and technical support.
' cx='32' cy='32' r='32' /%3E%3Ctext x='50%25' y='55%25' dominant-baseline='middle' text-anchor='middle' fill='%23FFF' %3ERP%3C/text%3E%3C/svg%3E)
I am getting 500 timeout / 503 service unavailable errors on my Azure App service. I am deploying code to our QA environment and the same code to our staging environment. The QA and staging environment both run on S2:1 service plans.
For some reason both hang and I get 4 minute response times for about 4 hours. The staging environment seems to recover at this point but the QA does not. I am trying to debug the issue by getting the memory dump and call stack profiler trace from diagnostic tools, but neither seem helpful. I have tried adding pdb to the Devops deployment to view what is going on in the profiler but when I try to load module symbols is does not find anything and I see that total CPU is 99% for [External Code]. Can someone help me get this setup properly?

Hi @raj p lartians ,
I'm not sure if you have seen https://azure.github.io/AppService/2018/06/06/App-Service-Diagnostics-Profiling-an-ASP.NET-Web-App-on-Azure-App-Service.html but it contains some insights on how to understand the report from the profiler trace. Including running the included *.diagsession through Perfview. Perfview will allow you to load your symbols to gain better insights on the trace file. Another option you could look at using Application Insights to profile your application.
Feel free to post any screen shots or attachments of your trace down below for an extra set of eyes.
Regards,
Ryan
Hi @Ryan Hill thanks for your response. I was able to find the profiler tool and run a trace to see what is being executed while the application is hanging. Here is a screenshot, but this doesn't appear to be originating from my code
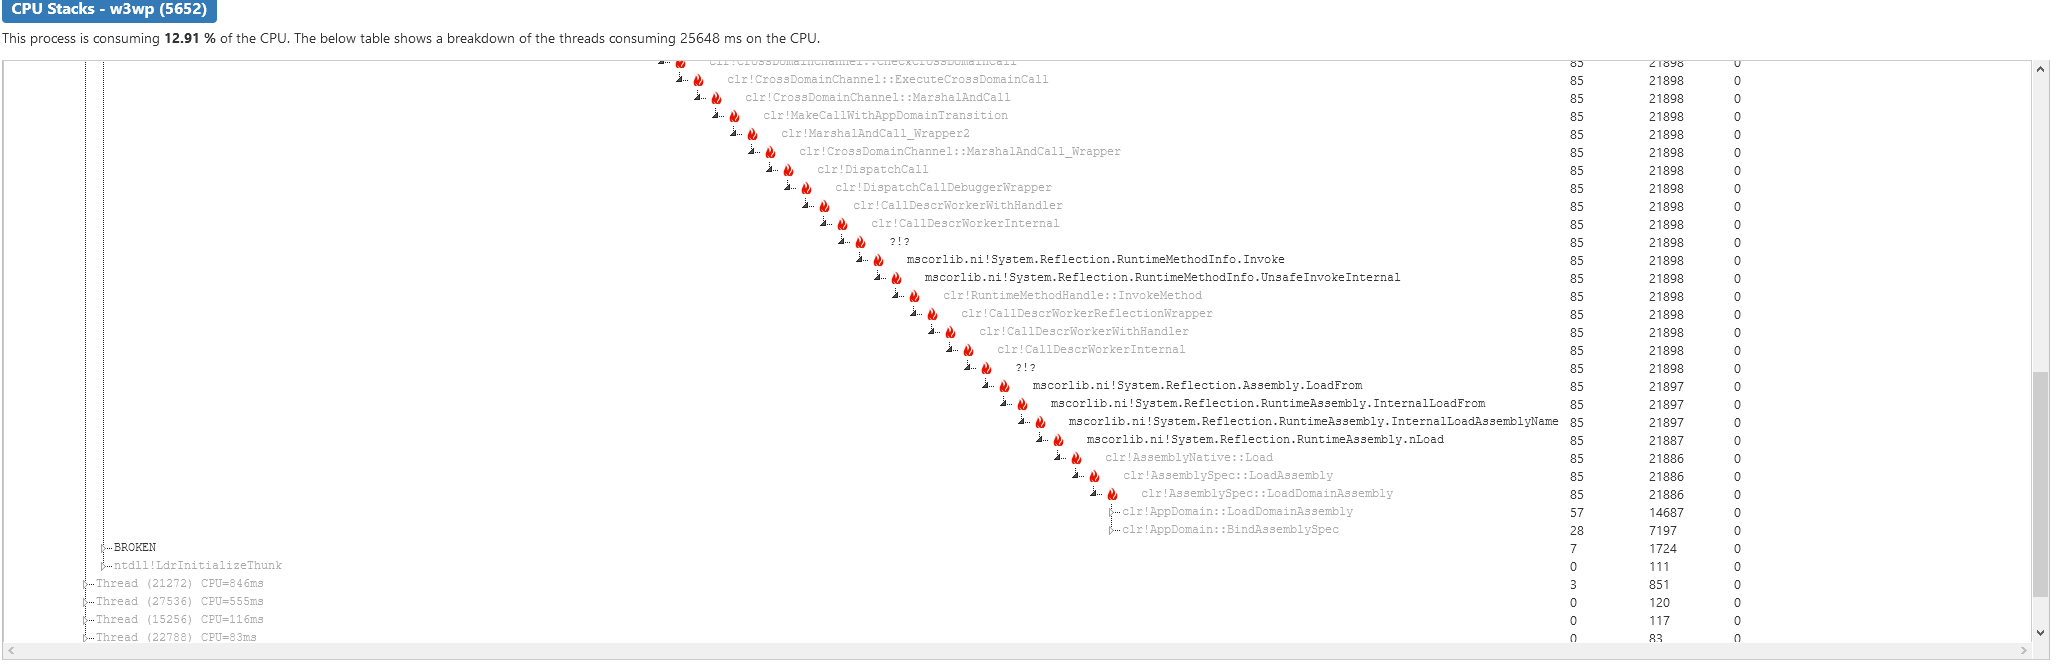
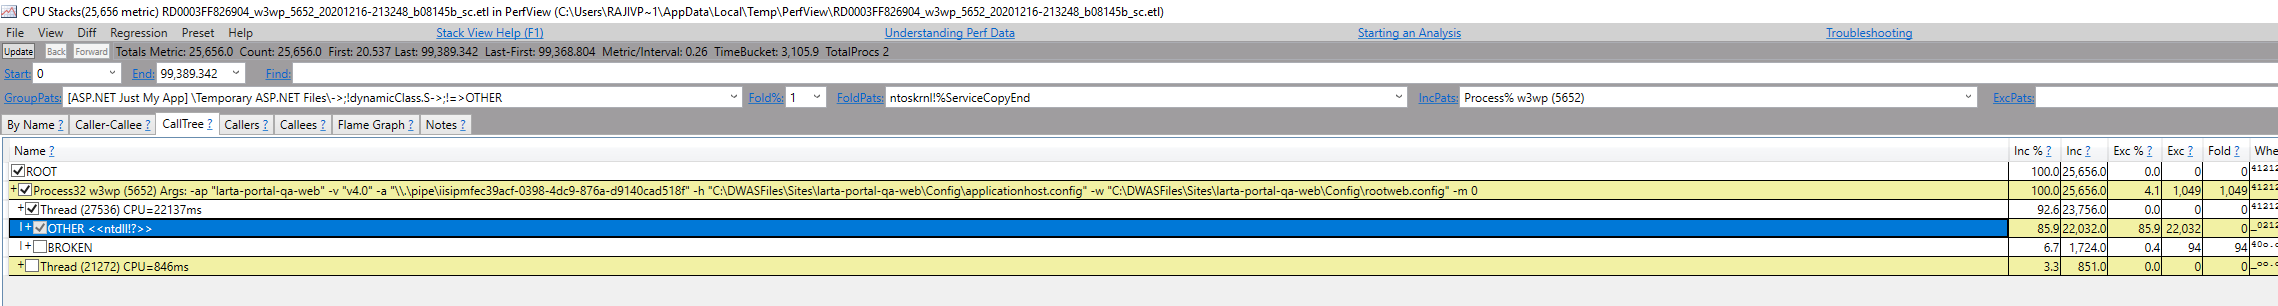
In perfview i see this, it appears to be related to NT.DLL?
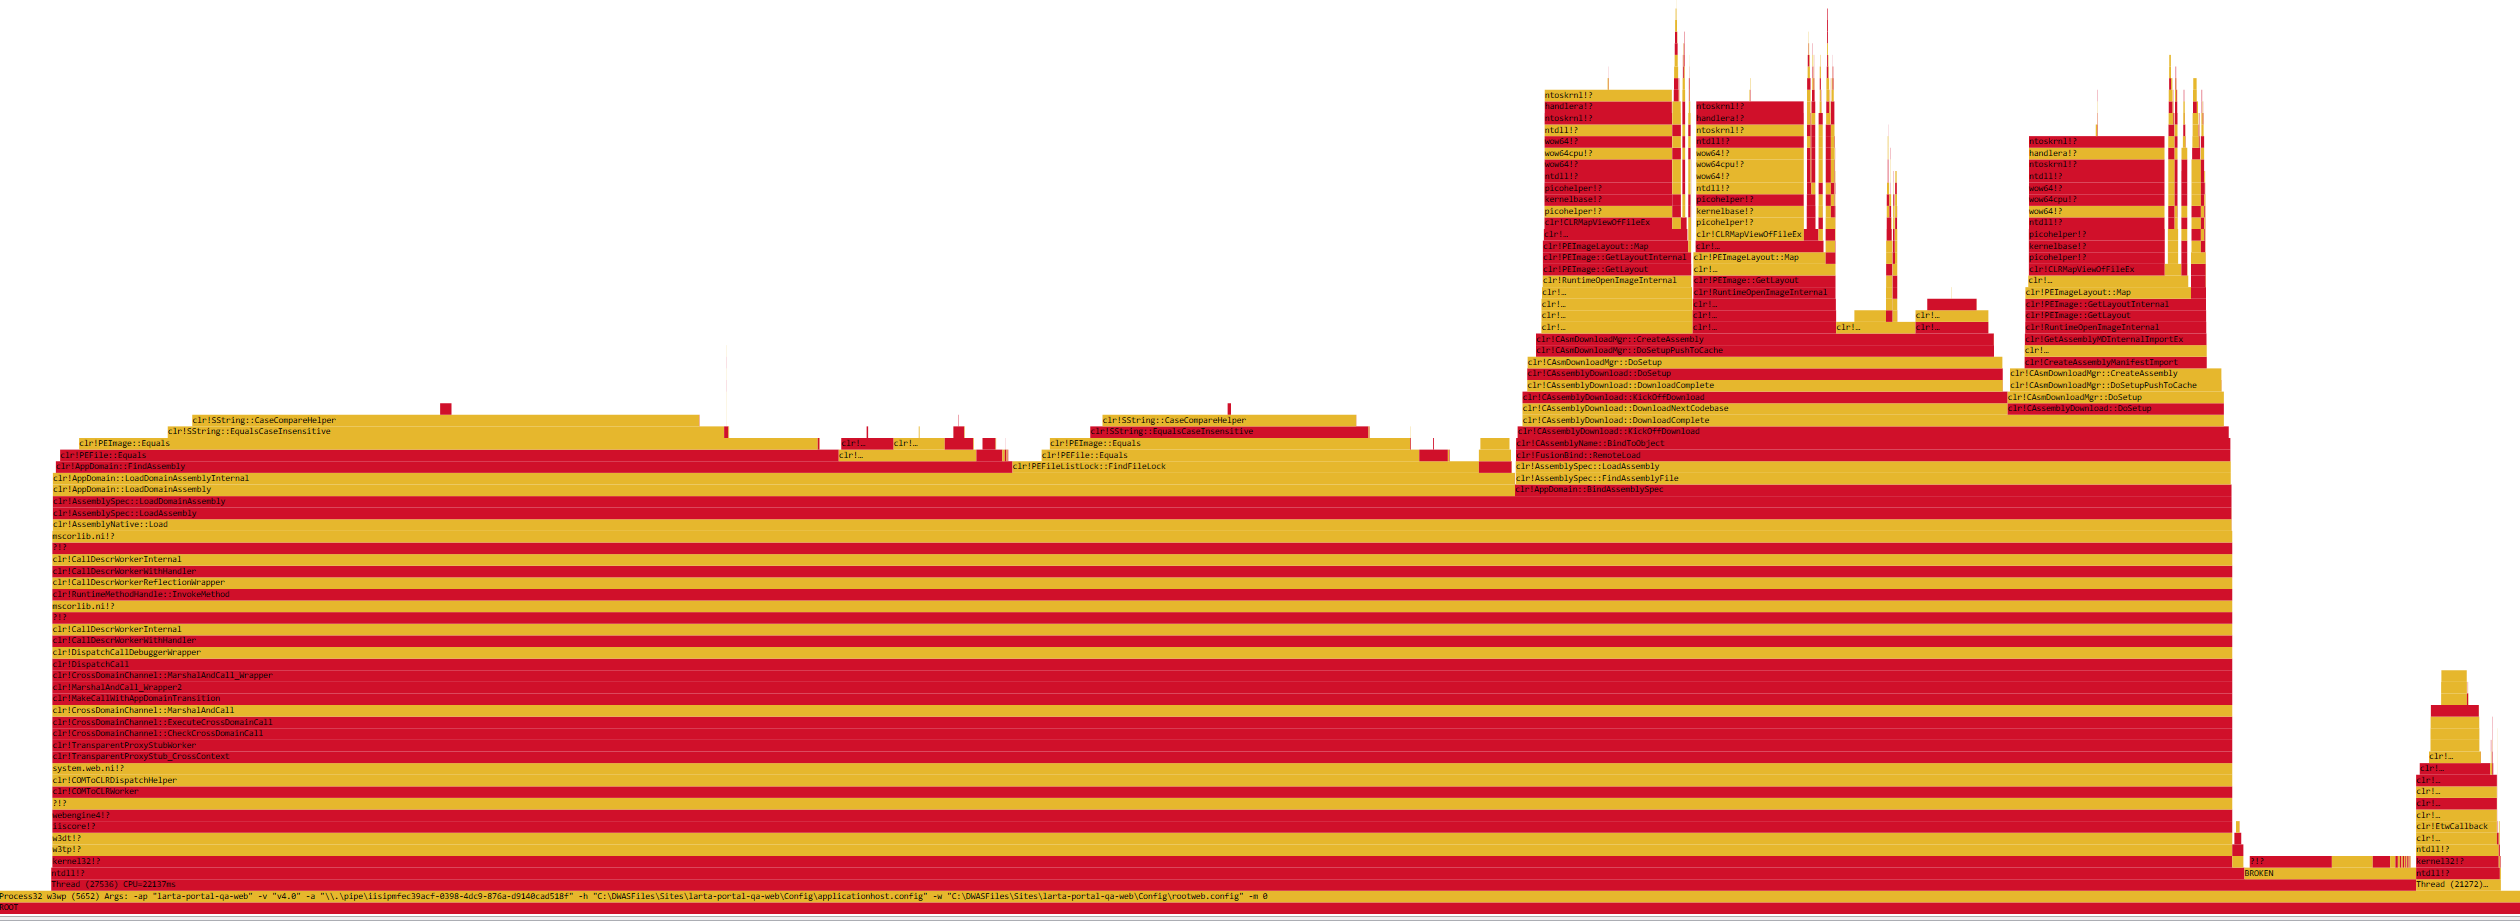
Also here is a flame graph:
Hi @raj p lartians ,
In Perfview, did you load the debug symbols for your application? Looking at the graphs you've provided, it looks like it's spending time loading an assembly. Are you doing anything like that? What assembly references are you using? What .NET version is your app?
@Ryan Hill The project is using .Net Framework 4.6.2. There are many custom assemblies in this project. I see almost 200 references. I am not sure how to find the debug symbols for my app when it is built with Azure Devops.
I created a task to 'Publish Symbols path' in the pipeline and set the Symbol Server type to 'this organization / collection (requires Azure Artifacts).' However, I don't see anything under Azure Artifacts that looks like my build to get or download the symbols for the build.
I followed this for visual studio 2019 and opened the trace but clicking load module symbols under external code doesn't do anything:
https://learn.microsoft.com/en-us/azure/devops/artifacts/symbols/debug-with-symbols-visual-studio?view=azure-devops
@raj p lartians that will setup to Visual Studio to pull symbols from artifacts on your Azure DevOps org. To use for a tool like Perfview, you can create an environment variable, adding https://artifacts.dev.azure.com/<yourOrg>/_apis/symbol/symsrv to the list. see https://learn.microsoft.com/en-us/azure/devops/artifacts/symbols/debug-with-symbols-windbg?view=azure-devops#add-the-symbol-server-to-windbg. Referencing the screen shot below, Variable value would be you SRV*C:\<your>\<local>\<directory>*http://msdl.microsoft.com/download/symbols*https://artifacts.dev.azure.com/<yourOrg>/_apis/symbol/symsrv.

PerfView will use _NT_SYMBOL_PATH and add any added symbol servers. You can also add Azure DevOps artifact server directly in the Symbol path dialog via File->Set Symbol Path.

Regards,
Ryan
Having said that, if all 200 references aren't built by your pipeline, you're at the mercy of the author/contributor having published those symbols to nuget.
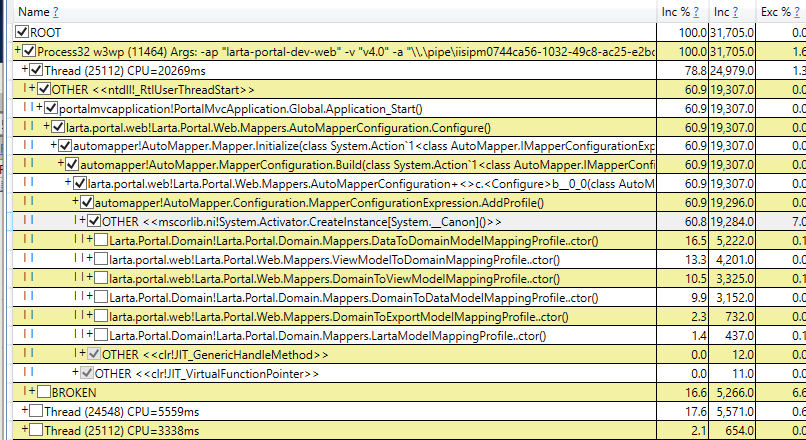
@Ryan Hill Thanks, I think I've got the PDB loaded correctly because I can see some calls to classes in my code now. In the pic below, I notice that Automapper config is taking a long time here, but it doesn't seem too long. Also this code hasn't changed for over 3 months and the problem only seemed to start a few weeks ago. Should I take a few snapshots over a period of like 1 hour to see if it continues to be stuck in the same set of functions?
That wouldn't be a bad idea @raj p lartians . I would also take a closer look at your Automapper implementation and look for any increased memory allocations. I speak from personal experience, Automapper is great but can experience significant performance issues if not used properly. Are you certain no code was changed? What about any updates to referenced packages? I would also check the quotas for your QA environment to ensure you're not hitting any upper thresholds.
Regards,
Ryan
I tried removing the latest updates to Automapper configs, but that did not make a difference. I am not hitting upper thresholds according to the max memory working set and CPU limits, though both are elevated in the QA environment. The QA environment and staging environment are both running off S2 tier and have the same code base so its weird that one would recover and the other does not. I am trying to find out which assembly it is getting stuck on loading but I don't see that option from the devops pipeline referenced here:
https://stackoverflow.com/questions/4921598/is-there-a-setting-to-show-assemblies-as-they-are-loaded-during-debugging-in-vis
Is there a way to show which assembly it is getting stuck loading?
@Ryan Hill is there a way to see which assembly it is getting stuck loading on in Azure? I see this in the eventlog.xml now:

@raj p lartians you can try creating WEBSITE_FUSIONLOGGING_ENABLED set to 1. This is a preview feature, https://azure.github.io/AppService/2020/09/16/Fusion-Logging-for-ASP.NET-Apps.html, so it may or may not work.
Regards,
Ryan
@raj p lartians were you able to use WEBSITE_FUSIONLOGGING_ENABLED?
Regards,
Ryan
@Ryan Hill I ended up just deleting the App Service and creating it again w/ the same Configuration settings. I deployed through Devops and everything seems to be working again. I am not sure why doing that works better than restarting the App Service or just re-deploying. I am sure the issue will come up again as I contacted the previous dev who said this has happened in the past and suggested deleting and re-creating. I will try the FUSIONLOGGING at that time.