What's the best way to visualize this data?

May Triggson 1 Reputation point
2021-01-10T22:05:35.07+00:00

I have tracked my mood and habits over the past year:

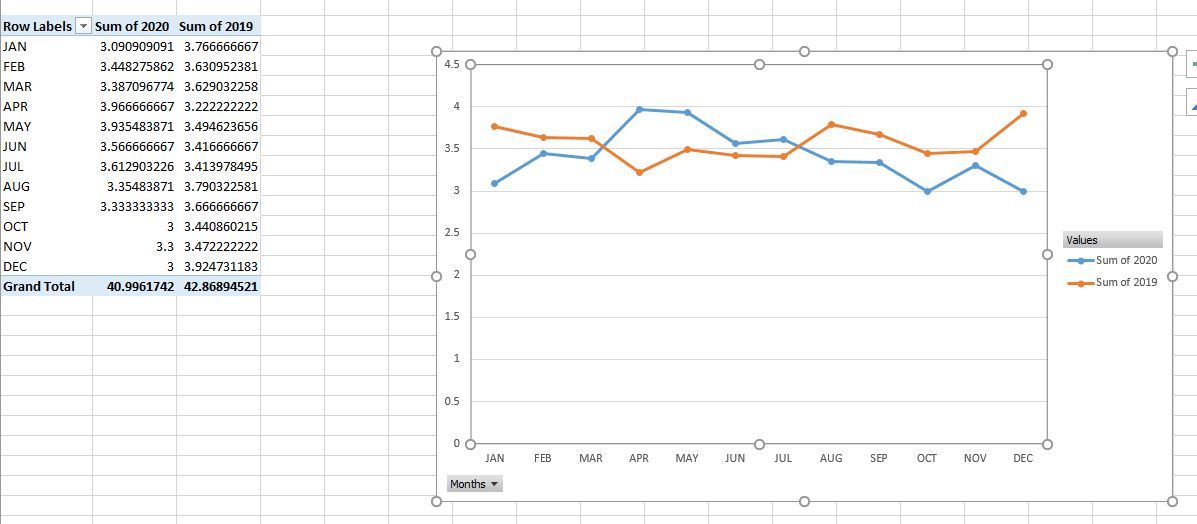
Mood has been visualized as follows (1-5, 5 being best, tracked daily, averaged out over month):

55121-mood.jpg

55095-1.jpg

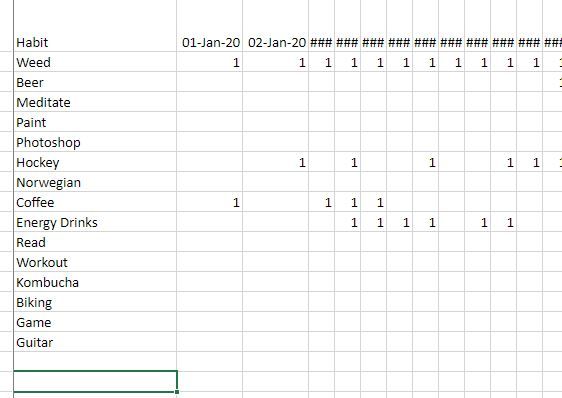
Habits have been tracked as follows, just not sure how I would visualize this in a chart?

55114-fffff.jpg

Would there be any way to cross reference the mood vs habits in a chart as well?

Thanks for any help!

PowerPoint Management
PowerPoint: A family of Microsoft presentation graphics products that offer tools for creating presentations and adding graphic effects like multimedia objects and special effects with text.Management: The act or process of organizing, handling, directing or controlling something.
222 questions
Excel Management
Excel Management
Excel: A family of Microsoft spreadsheet software with tools for analyzing, charting, and communicating data.Management: The act or process of organizing, handling, directing or controlling something.
1,657 questions
0 comments No comments
{count} votes

1 answer

Sort by: Most helpful
  1. Erin Ding-MSFT 4,456 Reputation points
    2021-01-11T09:54:13.43+00:00

    @May Triggson

    You could try to select the data of Habits, click Charts in the icon in the lower right corner, click More.
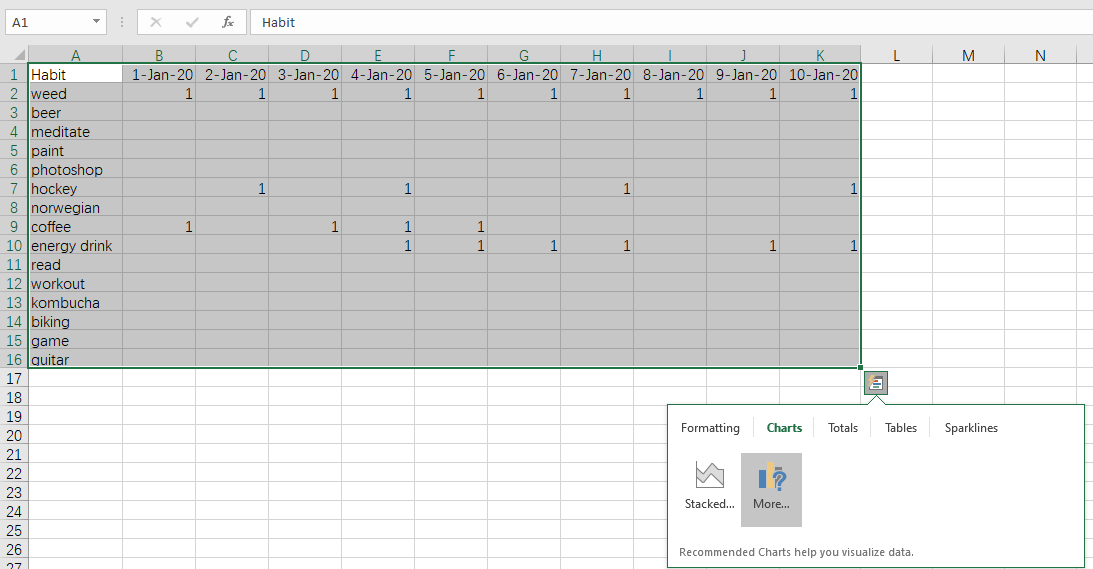
    55351-1.png
    Choose the chart you like in All Charts.
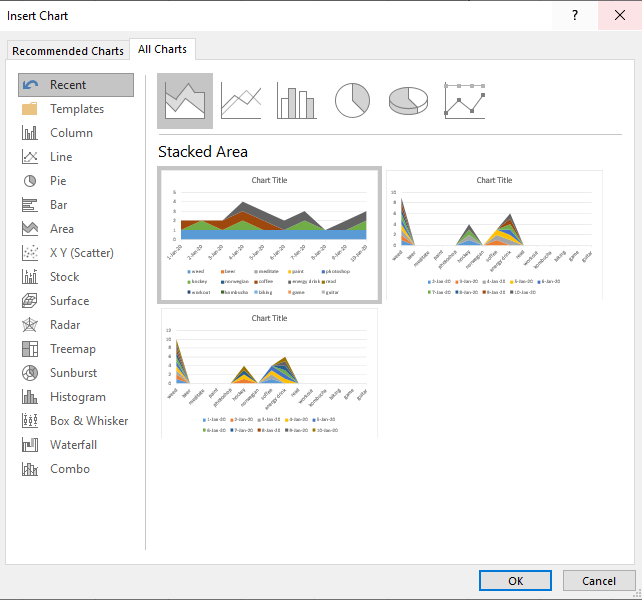
    55371-2.png
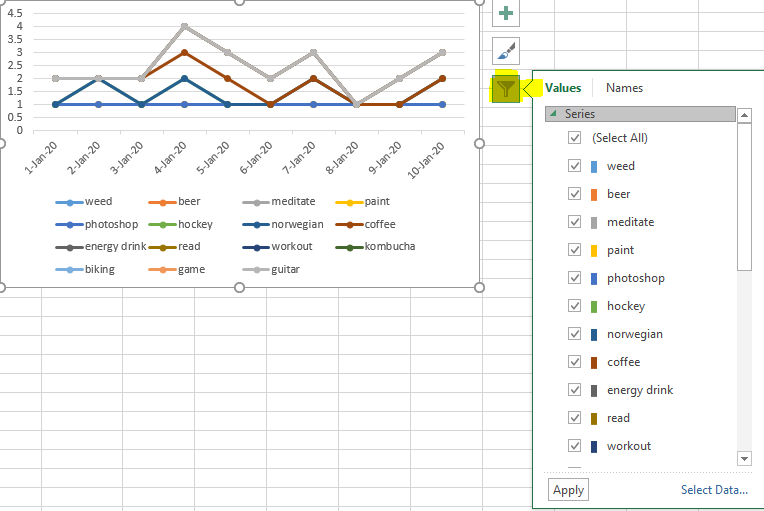
    You could filter the habit you would like to check.
    55343-3.png

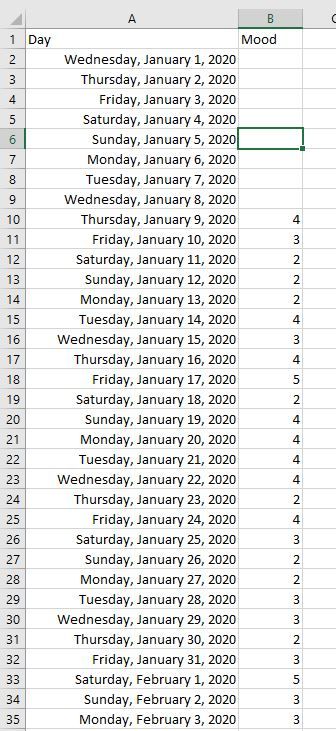
    If you want to cross reference the mood vs habits in a chart, you could try to put the two data in the same worksheet and correspond the date like below.
    55344-4.png
    Then you could follow the above steps to choose a chart for them.


    If an Answer is helpful, please click "Accept Answer" and upvote it.
    Note: Please follow the steps in our documentation to enable e-mail notifications if you want to receive the related email notification for this thread.

    1 person found this answer helpful.