how to customize charts in WPF? (using System.Windows.Controls.DataVisualization.Charting)

Aniket Khot 1 Reputation point
2020-04-15T20:55:15.187+00:00

i am working on LineSeries Chart . i want to have following customizations
7429-chart2.png

1) the Box in which legends are shown i wan to remove it , as i have single series i dont want legends and box. in my case an empty box is there. please refer the image

2) how to have tooltip of datapoint as always visible. by default i have to hover the mouse then it shoes the tooltip ,i want to be always visible

3) i have given name to the Y axis data points as "Time" . and due to which the all the data points on y axis have shifted to opposite side.
i want them to be on their original position. please refer the image

xaml for charts:

xmlns:dvc="clr-namespace:System.Windows.Controls.DataVisualization.Charting;assembly=System.Windows.Controls.DataVisualization.Toolkit"

<ItemsControl Name="charts" ItemsSource="{Binding ListOfSource}" >

                <ItemsControl.ItemsPanel>  
                    <ItemsPanelTemplate>  

                        <WrapPanel ></WrapPanel>  
                    </ItemsPanelTemplate>  
                </ItemsControl.ItemsPanel>  

                <ItemsControl.ItemTemplate>  

                    <DataTemplate>  

                        <Border BorderBrush="Black" BorderThickness="1" Margin="10" >  
                            <StackPanel>  
                                <Label Background="LightGray" x:Name="a" Content="{Binding TestCaseName}"/>  
                                <dvc:Chart BorderThickness="0" Height="300" Width="500" Name="Chart0" >  
                                    <dvc:Chart.Axes>  
                                        <dvc:CategoryAxis  Orientation="X">  
                                            <dvc:CategoryAxis.Title>  
                                                Readings  
                                            </dvc:CategoryAxis.Title>  
                                        </dvc:CategoryAxis>  

                                        <dvc:CategoryAxis  Orientation="Y">  

                                            <dvc:CategoryAxis.Title>  

                                                    Time   
                                            </dvc:CategoryAxis.Title>  
                                        </dvc:CategoryAxis>  
                                    </dvc:Chart.Axes>  
                                    <dvc:Chart.Series >  
                                        <dvc:LineSeries  

                                        ItemsSource="{Binding SeriesData}"  
                                        Title="{Binding}"  
                                        x:Name="LineChart0"  

                                        IndependentValueBinding="{Binding Col}"  
                                        DependentValueBinding="{Binding Value}">  

                                            <dvc:LineSeries.LegendItemStyle >  

                                                <Style TargetType="dvc:LegendItem">  
                                                    <Setter  Property="Visibility" Value="Collapsed"/>  
                                                </Style>  
                                            </dvc:LineSeries.LegendItemStyle>  

                                        </dvc:LineSeries>  
                                    </dvc:Chart.Series>  
                                </dvc:Chart>  
                            </StackPanel>  
                        </Border>  
                    </DataTemplate>  
                </ItemsControl.ItemTemplate>  
            </ItemsControl>
Windows Presentation Foundation
A part of the .NET Framework that provides a unified programming model for building line-of-business desktop applications on Windows.
2,694 questions
0 comments No comments
{count} votes

1 answer

Sort by: Most helpful
  1. Alex Li-MSFT 1,096 Reputation points
    2020-04-16T03:25:26.737+00:00

    Welcome to our Microsoft Q&A platform!

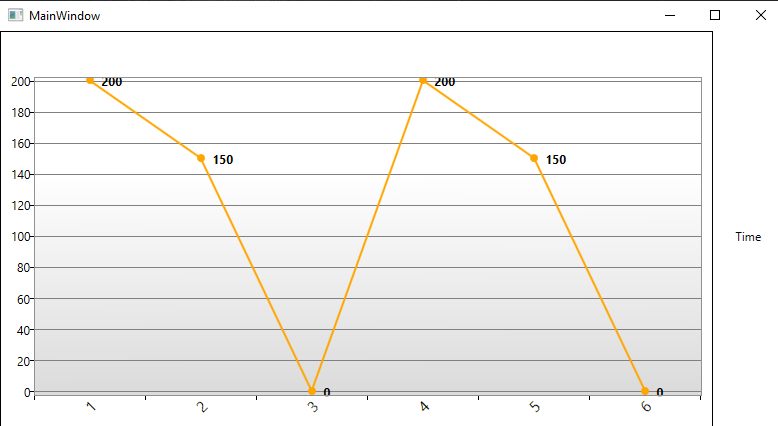
    I made a example,you can try it:

    add namespace:

     xmlns:dvc="clr-namespace:System.Windows.Controls.DataVisualization.Charting;assembly=System.Windows.Controls.DataVisualization.Toolkit"  
            xmlns:datavis="clr-namespace:System.Windows.Controls.DataVisualization;assembly=System.Windows.Controls.DataVisualization.Toolkit"  
            xmlns:chartingprimitives="clr-namespace:System.Windows.Controls.DataVisualization.Charting.Primitives;assembly=System.Windows.Controls.DataVisualization.Toolkit"  
    
    <Window.Resources>  
            <Style x:Key="DataPointStyle1" TargetType="{x:Type dvc:LineDataPoint}">  
                <Setter Property="Template">  
                    <Setter.Value>  
                        <ControlTemplate TargetType="dvc:LineDataPoint">  
                            <Grid>  
                                <Ellipse Fill="{TemplateBinding Background}"/>  
                                <Canvas >  
                                    <TextBlock FontWeight="Bold" Text="{Binding Value}" Margin="15,-3,0,0"  />  
                                </Canvas>  
                            </Grid>  
                        </ControlTemplate>  
                    </Setter.Value>  
                </Setter>  
            </Style>  
        </Window.Resources>  
        <Window.DataContext>  
            <local:MyClass/>  
        </Window.DataContext>  
        <Grid >  
            <dvc:Chart >  
                <dvc:Chart.Template>  
                    <ControlTemplate TargetType="{x:Type dvc:Chart}">  
                        <Grid>  
                            <Grid.ColumnDefinitions>  
                                <ColumnDefinition Width="10*"/>  
                                <ColumnDefinition Width="*"/>  
                            </Grid.ColumnDefinitions>  
                            <Border Background="{TemplateBinding Background}" BorderBrush="{TemplateBinding BorderBrush}" BorderThickness="{TemplateBinding BorderThickness}" Padding="{TemplateBinding Padding}">  
                                <Grid>  
                                    <Grid.RowDefinitions>  
                                        <RowDefinition Height="Auto" />  
                                        <RowDefinition Height="*" />  
                                    </Grid.RowDefinitions>  
                                    <datavis:Title Content="{TemplateBinding Title}" Style="{TemplateBinding TitleStyle}" />  
                                    <chartingprimitives:EdgePanel Name="ChartArea" Style="{TemplateBinding ChartAreaStyle}" Grid.Row="1" Margin="0,15,0,15">  
                                        <Grid Panel.ZIndex="-1" Style="{TemplateBinding PlotAreaStyle}" />  
                                        <Border Panel.ZIndex="10" BorderBrush="#FF919191" BorderThickness="1" />  
                                    </chartingprimitives:EdgePanel>  
                                </Grid>  
                            </Border>  
                            <Label Content="Time" Grid.Column="1" VerticalAlignment="Center" HorizontalAlignment="Center"/>  
                        </Grid>  
                         
      
                    </ControlTemplate>  
                      
                </dvc:Chart.Template>  
                <dvc:Chart.Axes>  
                        <dvc:CategoryAxis Orientation="X">  
                            <dvc:CategoryAxis.AxisLabelStyle>  
                                <Style x:Name="labelStyleX1" TargetType="Control">  
                                    <Setter Property="FontSize" Value="15"/>  
                                    <Setter Property="LayoutTransform" >  
                                        <Setter.Value>  
                                            <RotateTransform  Angle="-45" />  
                                        </Setter.Value>  
                                    </Setter>  
                                    <Setter Property="Foreground" Value="Black"/>  
                                </Style>  
                            </dvc:CategoryAxis.AxisLabelStyle>  
                        </dvc:CategoryAxis>  
                    </dvc:Chart.Axes>  
                <dvc:Chart.Series>  
                    <dvc:LineSeries ItemsSource="{Binding Line1}"   
                               DependentValuePath="Value"   
                               IndependentValuePath="Id"   DataPointStyle="{StaticResource DataPointStyle1}">  
                            <dvc:LineSeries.LegendItemStyle >  
                                <Style TargetType="dvc:LegendItem">  
                                    <Setter Property="Visibility" Value="Collapsed"/>  
                                </Style>  
                            </dvc:LineSeries.LegendItemStyle>  
                        </dvc:LineSeries>  
                    </dvc:Chart.Series>  
                </dvc:Chart>  
            </Grid>  
    

    C# code:

     public class MyClass  
        {  
            public MyClass()  
            {  
                Line1.Add(new Data() { Id = 1, Value = 200 });  
                Line1.Add(new Data() { Id = 2, Value = 150 });  
                Line1.Add(new Data() { Id = 3, Value = 0 });  
                Line1.Add(new Data() { Id = 4, Value = 200 });  
                Line1.Add(new Data() { Id = 5, Value = 150 });  
                Line1.Add(new Data() { Id = 6, Value = 0});  
               
            }  
            public List<Data> Line1 { get; set; } = new List<Data>();  
            public class Data  
            {  
                public int Value { get; set; }  
                public int Id { get; set; }  
            }  
        }  
    

    7501-annotation-2020-04-16-112311.png

    0 comments No comments