Developer technologies | Visual Studio | Debugging
A core feature of Visual Studio that allows developers to inspect, analyze, and troubleshoot code during execution.
This browser is no longer supported.
Upgrade to Microsoft Edge to take advantage of the latest features, security updates, and technical support.
' cx='32' cy='32' r='32' /%3E%3Ctext x='50%25' y='55%25' dominant-baseline='middle' text-anchor='middle' fill='%23FFF' %3EE%3C/text%3E%3C/svg%3E)
I thought of moving things to inline function to organise code without making it slower, but when running in debug that makes it impossible to break in that code or enter that function in any way.
That's true of even basic examples, like
`
inline void Function(int* a, int b, int c)
{
for (int i = 0; i < 100; i++)
c[i] = a[i] + b[i];
}
int main()
{
int a[100], b[100], c[100];
for (int i = 0; i < 100; i++)
a[i] = b[i] = 5;
Function(a, b, c);
}
`
(And what's the deal with the code showing here as one line?)
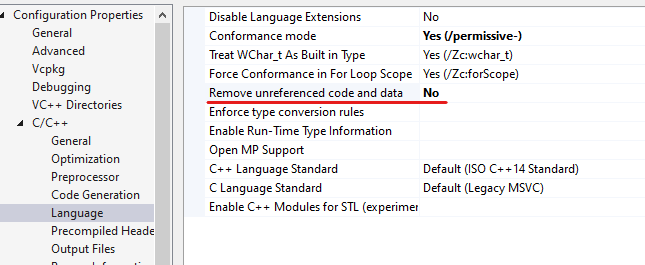
Microsoft Learn talk about the /Zo switch, how it's enabled by default, and that it allows debugging inlines, but that doesn't seem to be the case. (I tried setting it manually, it didn't help.)
Is this functionality available, and if not, can anything be done?
I tried this with the Visual Studio 2019 and 2017 (fully updated).
' cx='32' cy='32' r='32' /%3E%3Ctext x='50%25' y='55%25' dominant-baseline='middle' text-anchor='middle' fill='%23FFF' %3EDL%3C/text%3E%3C/svg%3E)
Are you trying to debug a debug or release build?
/Zo is apparently only effective on optimized (release) builds.
Release.

If you want to debug a Release version, you must clear all optimizations and set many other compiler options to debug mode. It is easier to compile and only debug a Debug version.
Why do you want to debug a Release version?
Can you supply a simple example project that anyone can use to reproduce this situation?
Create the default command line project, copy and past the code I supplied (unfortunately the forum killed its formatting), try putting a breakpoint inside the inline function or stepping into it. Doesn't work.
In this case I want to debug the release version because it performs much faster -- partly because of inlining.
But in the past I also debugged release code to find bugs that only happened in release.
With such a trivial example, in a release build the compiler is smart enough to remove all the code, so you need to come up with something that does result in some code generation.
Without the inline function it's possible to debug the code. It's harder than in debug mode, because the index for example jumps by 16 each time, but at least something is possible. Therefore I can't imagine the compiler 'removing the code'. It's obviously still doing something, and my guess would be it's doing the exact same thing as if the code was inside the main.
The difference is, when the code is inside the main it can be debugged, when it's in an inline function it can't be. That's my problem. If I want to break out parts of the code, but still keep the performance by using inlining, I'm losing the ability to debug.
If you can't imagine the compiler removing the code (because overall it has no result), give what you've told us a try. When you step into the code, switch to the disassembly view.
It has a result. It adds a and b into c. The result can be viewed in the debugger.
And why don't you take your own advice and look at the assembly code? I can see quite a few instructions which make up Function().
But those are not used subsequently, so the compiler can discard it all!
--- C:\Users\David\Source\Repos\InlineDebugTest\InlineDebugTest.cpp ------------
14: int a[100], b[100], c[100];
15: for ( int i = 0; i < 100; i++ )
16: a[i] = b[i] = 5;
17: Function( a, b, c );
18: }
00F91000 33 C0 xor eax,eax
00F91002 C3 ret
Here's what it shows for me:
Function(a, b, c);
003D1033 xor eax,eax
003D1035 pop edi
003D1036 nop word ptr [eax+eax]
003D1040 movups xmm0,xmmword ptr a[eax*4]
003D1048 movups xmm1,xmmword ptr b[eax*4]
003D1050 paddd xmm1,xmm0
003D1054 movups xmm0,xmmword ptr [ebp+eax*4-184h]
003D105C movups xmmword ptr c[eax*4],xmm1
003D1064 movups xmm1,xmmword ptr [ebp+eax*4-314h]
003D106C paddd xmm1,xmm0
003D1070 movups xmm0,xmmword ptr [ebp+eax*4-174h]
003D1078 movups xmmword ptr [ebp+eax*4-4A4h],xmm1
003D1080 movups xmm1,xmmword ptr [ebp+eax*4-304h]
003D1088 paddd xmm1,xmm0
003D108C movups xmm0,xmmword ptr [ebp+eax*4-164h]
003D1094 movups xmmword ptr [ebp+eax*4-494h],xmm1
...
It does go through a loop in the assembly code, as expected.
(Sorry for cutting it, crappy forum limits to 1000 chars. What was Microsoft thinking?)
Share your example project/solution somewhere (OneDrive perhaps) so that we're all singing from the same hymn sheet.
' cx='32' cy='32' r='32' /%3E%3Ctext x='50%25' y='55%25' dominant-baseline='middle' text-anchor='middle' fill='%23FFF' %3EDZ%3C/text%3E%3C/svg%3E)
Hi ET3D,
 Best Regards,
Dylan
Best Regards,
Dylan If the answer is helpful, please click "Accept Answer" and upvote it.
Note: Please follow the steps in our *
*documentation* to enable e-mail notifications if you want to receive the related email notification for this thread.**
Didn't help, unfortunately.
' cx='32' cy='32' r='32' /%3E%3Ctext x='50%25' y='55%25' dominant-baseline='middle' text-anchor='middle' fill='%23FFF' %3EM%3C/text%3E%3C/svg%3E)
Do not know your exact compiler/linker flags. But obviously debugger has some difficulties with your code sample Release / Inline and the generated symbols.
Here is a picture of Windbg Preview - which has a more talkative Symbol Engine - trying to reach a breakpoint in Inline Function.
Interesting the ambigous symbol and no locals. There seems to be some (flaky) line info available :
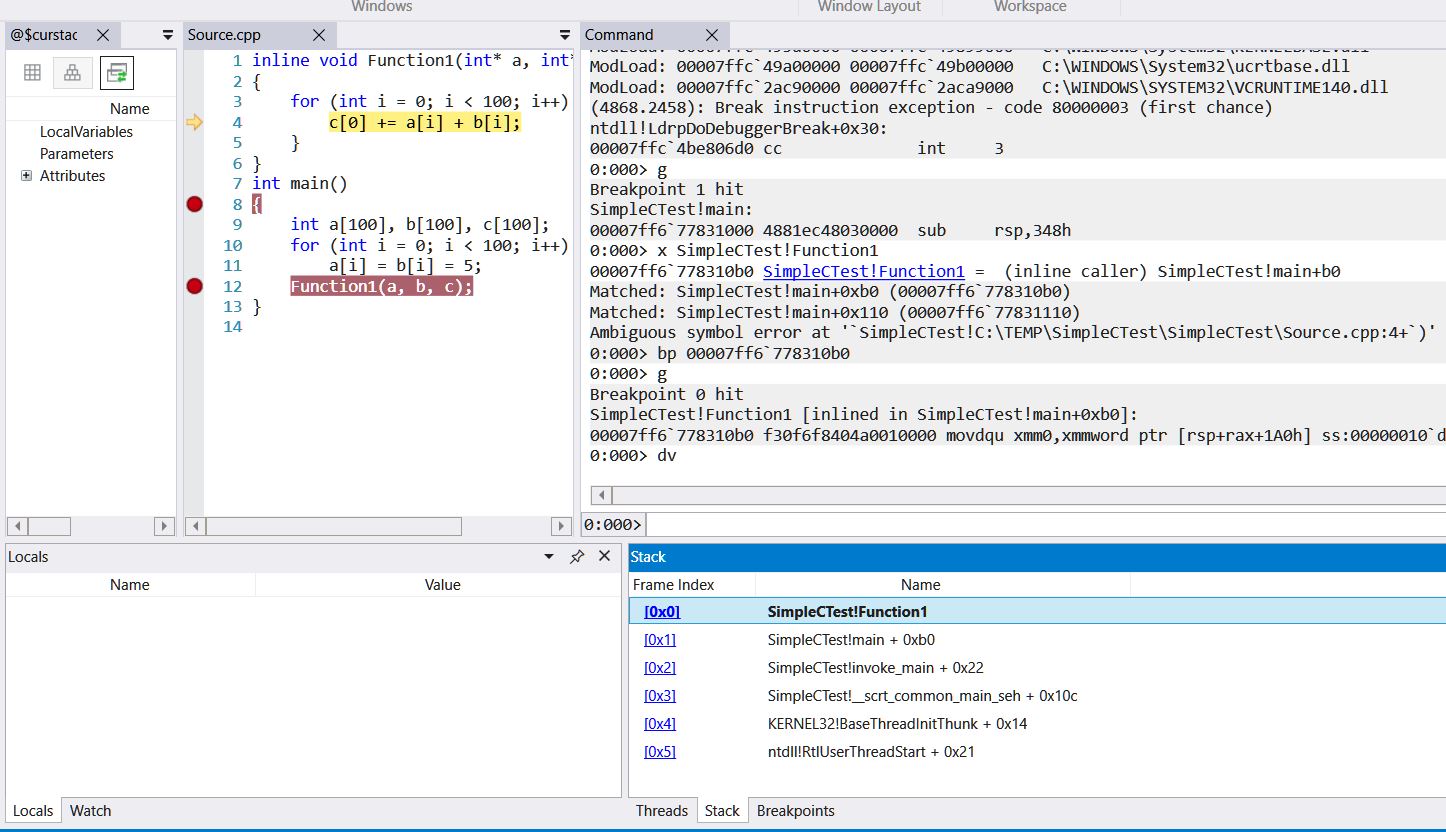
Thanks for checking it out. Do you have any idea what this means?
Here are some internals about debugging optimized code and inlining:
https://learn.microsoft.com/en-us/windows-hardware/drivers/debugger/debugging-optimized-code-and-inline-functions-external
Please bear in mind that "Windows debugger" refers to the debuggers of "Debugging Tools for Windows"(legacy windbg, cdb, kd) or "WinDbg Preview".
VS debuggers used to support only a subset of dbgcmds - no joy with context-operator or "x" in VS 2015 in Immediate window.
https://learn.microsoft.com/en-us/visualstudio/debugger/context-operator-cpp?view=vs-2019
In VS would try to set breakpoint on source line
Function(a, b, c);
then change to Disassembly and "Step Into" (F11)
or set bp in in Disassembly window (there 'Show Source Code' enabled).
