Not Monitored
Tag not monitored by Microsoft.
36,538 questions
This browser is no longer supported.
Upgrade to Microsoft Edge to take advantage of the latest features, security updates, and technical support.
' cx='32' cy='32' r='32' /%3E%3Ctext x='50%25' y='55%25' dominant-baseline='middle' text-anchor='middle' fill='%23FFF' %3ES%3C/text%3E%3C/svg%3E)
Hi everyone.
I wish to create a moving average in power query from data imported from the internet.
The idea is to replicate de Harvard Index calculation to keep track of the coronavirus situation in my country and visualize it in a pivot table and pivot chart with automatic updates.
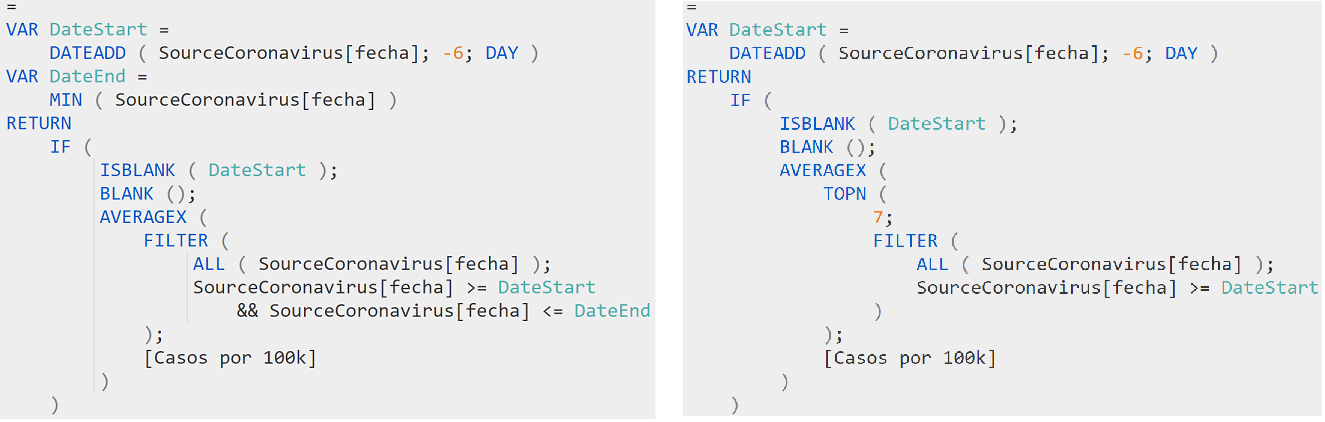
So, I'm importing data from a github with statistics on Coronavirus in my country. From the data I select "New cases" column and perfom the calculations, in M, to get the per 100k cases. The Harvard Index calculation would be the average of the last 7 days of the per 100k cases. But I cannot figure out how to create a 7 day moving average in M.
File here: https://1drv.ms/x/s!AmrjlXSYqMxe4QQOdP8rl9xCjKLE?e=b2Nf2d
Another file with the expected column using DAX in power pivot: https://1drv.ms/x/s!AmrjlXSYqMxe4QIqsLPpUr-TBOQ_?e=Z0rCPw
Cheers!
@Lz._

Hi @Shinka
Thanks for providing the EN column names + the expected result. PQ version:
let
    Source = Csv.Document(
        Web.Contents("https://raw.githubusercontent.com/GUIAD-COVID/datos-y-visualizaciones-GUIAD/master/datos/estadisticasUY.csv"),
        [Delimiter=",", Columns=16, Encoding=65001, QuoteStyle=QuoteStyle.None]
    ),
    PromotedHeaders = Table.PromoteHeaders(Source, [PromoteAllScalars=true]),
    RequiredColumns = Table.SelectColumns(PromotedHeaders,
        {"fecha", "cantPersonasConInfeccionEnCurso", "cantCasosNuevos", "cantTest"}
    ),
    ChangesTypes = Table.TransformColumnTypes(RequiredColumns,
        {<!-- -->{"fecha", type date}, {"cantPersonasConInfeccionEnCurso", Int64.Type}, {"cantCasosNuevos", Int64.Type}, {"cantTest", Int64.Type}}
    ),
    PositiveTests = Table.AddColumn(ChangesTypes, "% de test positivos", each
        [cantCasosNuevos]/[cantTest], Percentage.Type
    ),
    CasesPer100k = Table.AddColumn(PositiveTests, "Casos por 100k", each
        ([cantCasosNuevos]/3461734)*100000, type number
    ),
    Index = Table.AddIndexColumn(CasesPer100k, "Index", 1, 1),
    HarvardIndex = Table.AddColumn(Index, "Índice de Harvard", each
        if [Index] < 7 then null
        else
            List.Average(
                List.Range(
                    Table.Column(Index, "Casos por 100k"), [Index]-7, 7
                )
            ),
        type number
    ),
    RemovedIndex = Table.RemoveColumns(HarvardIndex,{"Index"})
in
    RemovedIndex
Corresponding workbook avail. here
Cheers :)
"fecha" = "Date"
"cantPersonasConInfeccionEnCurso" = "Persons currently infected"
"cantCasosNuevos" = "New cases"
"cantTest" = "Tests performed"
@Lz._
Thank you so much! Works great, it's fantastic!
@Shinka . Glad I could help & Thanks for posting back
Workbook updated with a PQ+PP option (measures only, no EARLIER) that's probably a more scalable
Hi @Emily Hua-MSFT (or any advanced PowerPivot user). If you don't mind and know... From an efficiency perspective how do the following 2 measures compare?
FILTER with 2 conditions vs. TOPN(..., FILTER with 1 condition)