Not Monitored
Tag not monitored by Microsoft.
38,422 questions
This browser is no longer supported.
Upgrade to Microsoft Edge to take advantage of the latest features, security updates, and technical support.
' cx='32' cy='32' r='32' /%3E%3Ctext x='50%25' y='55%25' dominant-baseline='middle' text-anchor='middle' fill='%23FFF' %3EFO%3C/text%3E%3C/svg%3E)
Hello,
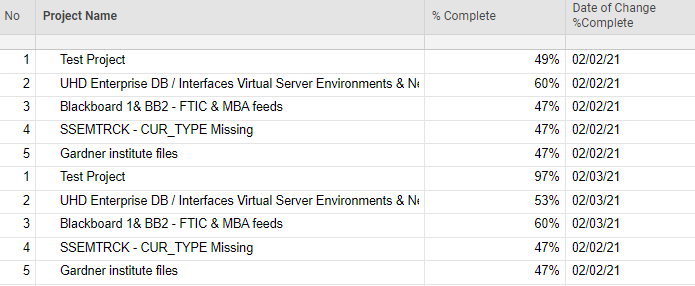
I have a table that stores daily data related to the progress of projects. Therefore, a project has one row per day.
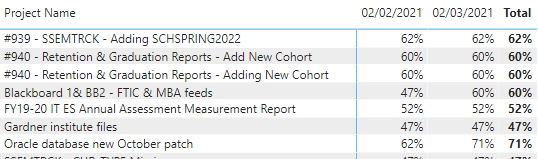
I'm interested in the difference of the %complete progress between the last two dates available in the table for each project name.
Similar to the table below, I need to present a matrix that contains the project name, the last 2 %complete values based on the last 2 dates, and the difference between those values.
Does someone know how to make this work?
This is an example of my original table:
I will appreciate your suggestions. :)
' cx='32' cy='32' r='32' /%3E%3Ctext x='50%25' y='55%25' dominant-baseline='middle' text-anchor='middle' fill='%23FFF' %3EA%3C/text%3E%3C/svg%3E)
Power Bi is not currently supported here on QnA. The product group for Power Bi actively monitors questions over at
https://community.powerbi.com/
--please don't forget to Accept as answer if the reply is helpful--
Thank you!
Just asked to the correct group.
Sounds good, you're welcome.