How to write queries for synapse on log analytics

@maddy 1 Reputation point
2021-02-18T12:06:09.253+00:00

Hi Team,

I want to find the long running queries in synapse and want to pin its results to dashboard.

I have sql query for this one

SELECT TOP 10 *
FROM sys.dm_pdw_exec_requests
ORDER BY total_elapsed_time DESC

But i want to run this in log analytics workspace so i can pin the results to dashboard.

I have checked in my log analytics workspace but i couldn't find any table there which has logs of synapse.

Please let me know how this can be done.

Thanks & Regards,
MSD

Azure Monitor
Azure Monitor
An Azure service that is used to collect, analyze, and act on telemetry data from Azure and on-premises environments.
3,189 questions
Azure Synapse Analytics
An Azure analytics service that brings together data integration, enterprise data warehousing, and big data analytics. Previously known as Azure SQL Data Warehouse.
4,848 questions
{count} votes

2 answers

Sort by: Most helpful
  1. PRADEEPCHEEKATLA-MSFT 88,561 Reputation points Microsoft Employee
    2021-02-19T11:59:03.187+00:00

    Hello @@maddy ,

    Here are the different ways to find top 10 queries longest running queries in Synapse:

    Method1: Monitor workload - Azure portal using Log Analytics

    Step1: Configure diagnostic settings to emit logs from your SQL pool. Logs consist of telemetry views equivalent to the most commonly used performance troubleshooting DMVs.

    69975-image.png

    Step2: Navigate to your Log Analytics workspace where you can do the following:

    • Analyze logs using log queries
    • Pin query results to a dashboard

    70101-image.png

    69976-image.png

    70053-azsqlpool-longrunningquery.gif

    Method2: Monitor your Azure Synapse Analytics dedicated SQL pool workload using DMVs

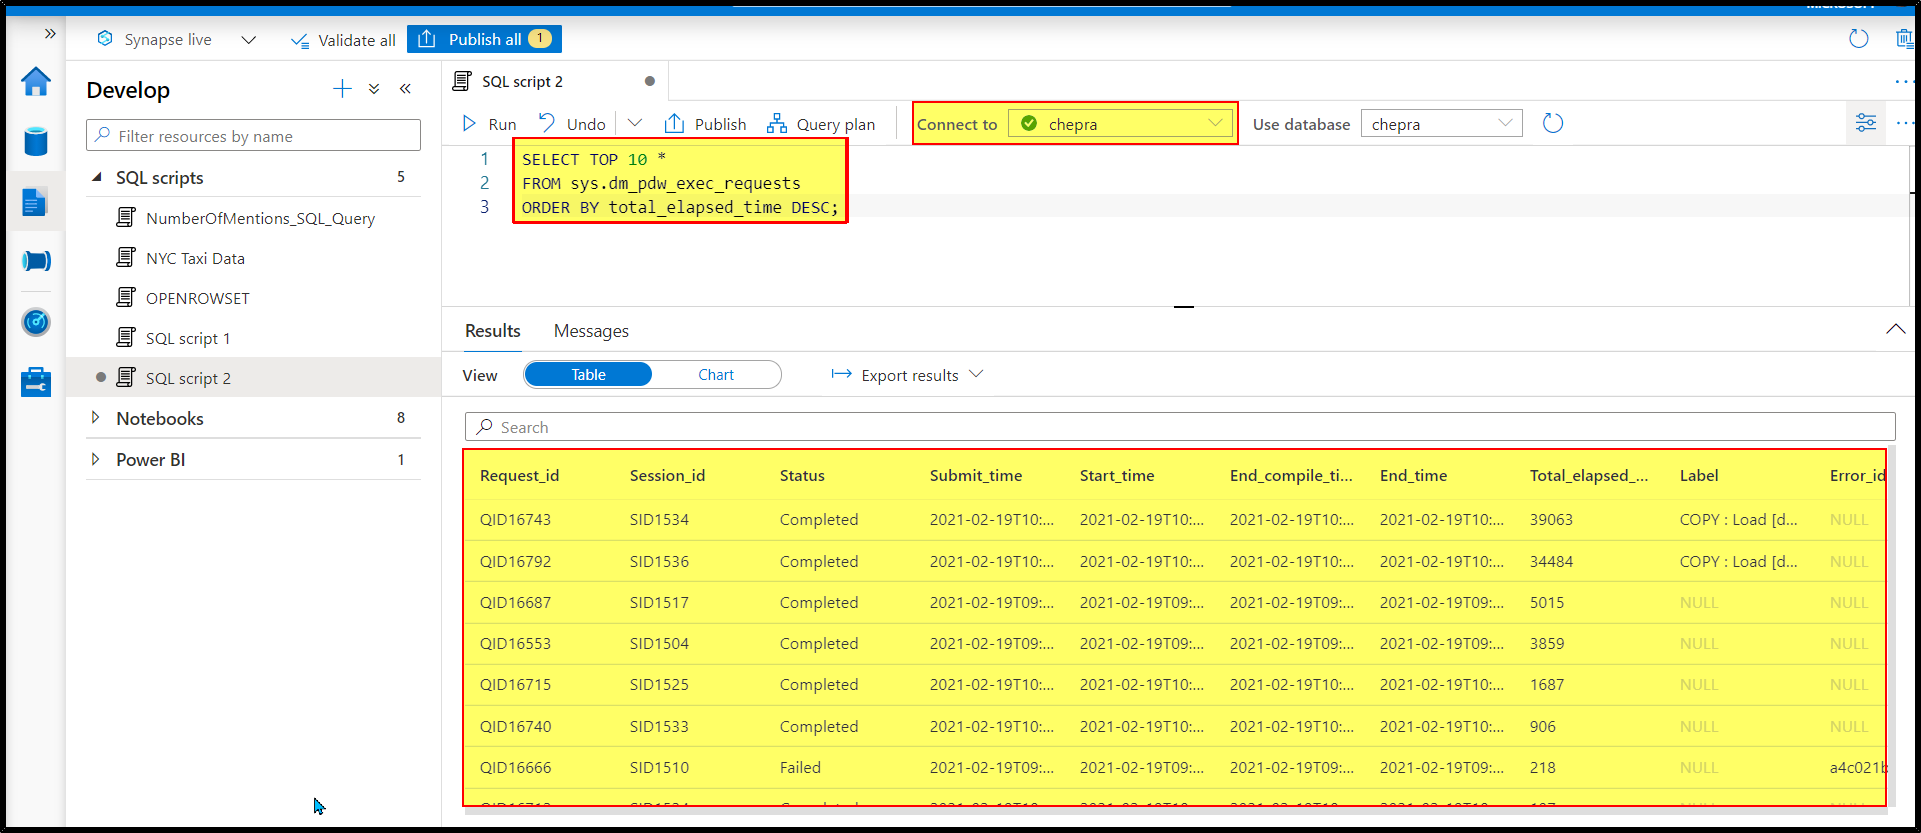
    Step1: Open Azure Synapse Studio and create a sql script.

    Step2: Run the top 10 queries longest running queries in Synapse.

    -- Find top 10 queries longest running queries  
    SELECT TOP 10 *  
    FROM sys.dm_pdw_exec_requests  
    ORDER BY total_elapsed_time DESC;  
    

    70102-image.png

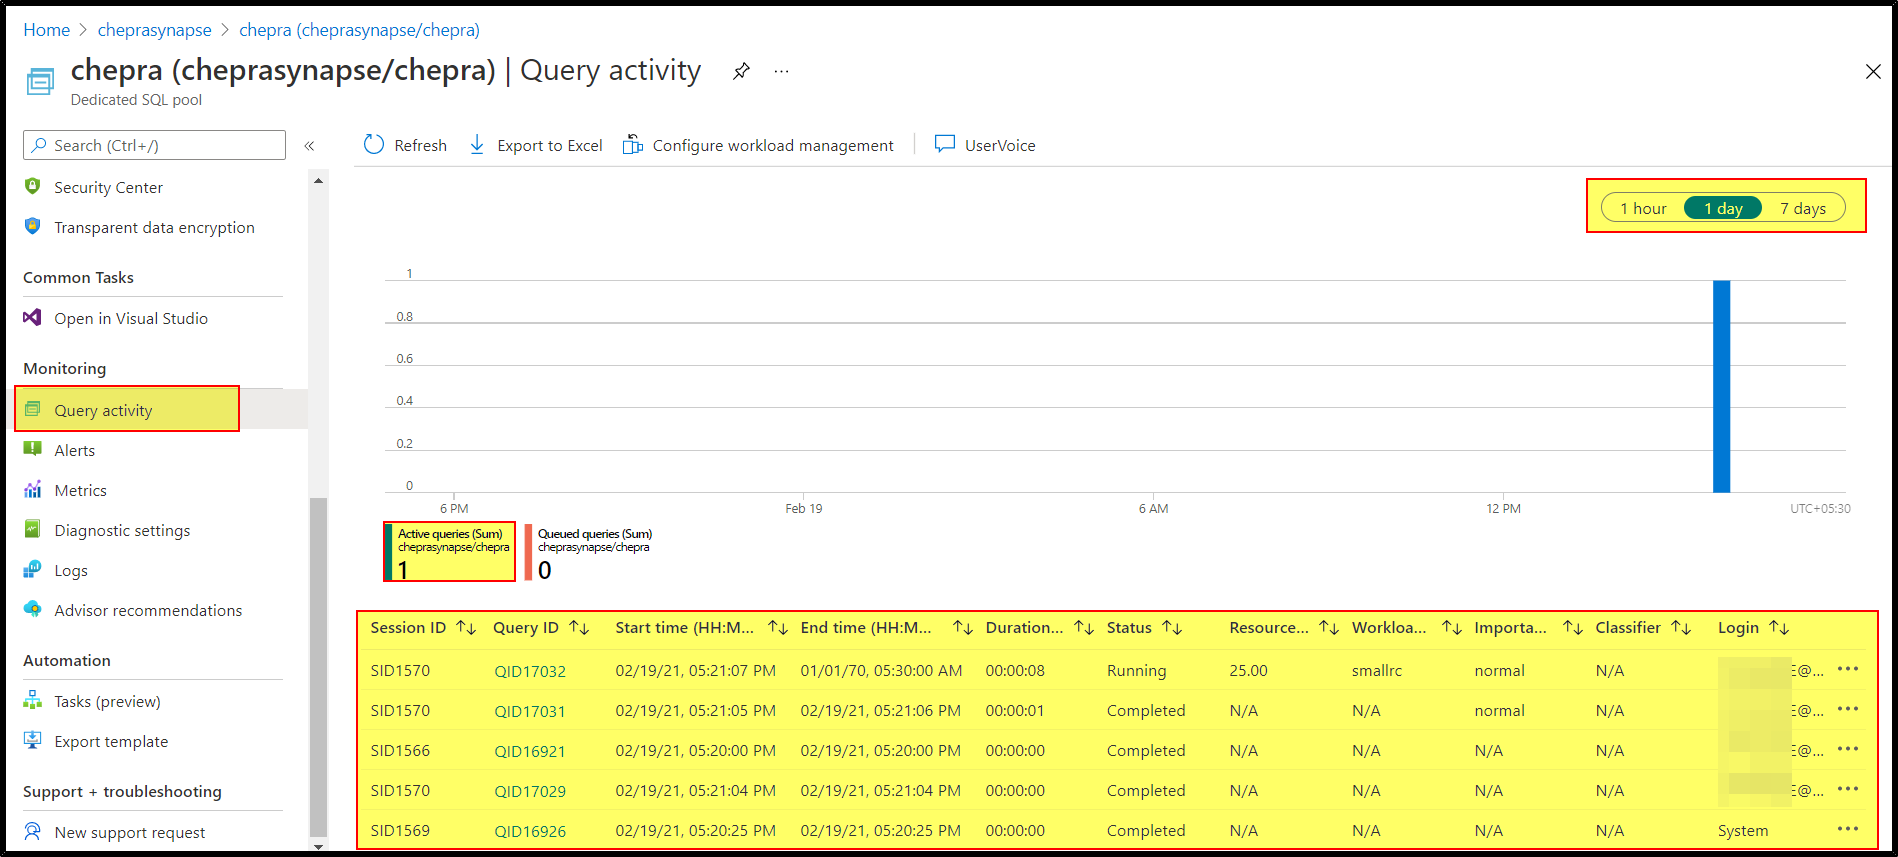
    Method3: Monitor your Azure Synapse Analytics dedicated SQL pool workload using Azure Portal

    Step1: Go to Azure Synapse Analytics workspace => Analytics Pools => SQL Pools

    Step2: Select the SQL Pool => Under Monitoring section => Query activity
    70111-image.png

    Hope this helps. Do let us know if you any further queries.

    ------------

    Please don’t forget to Accept Answer and Up-Vote wherever the information provided helps you, this can be beneficial to other community members.

    1 person found this answer helpful.

  2. Samara Soucy - MSFT 5,051 Reputation points
    2021-02-19T05:06:53.077+00:00

    Make sure you have configurated your synapse pool to push these logs to a Log Analytics workspace. With your pool open in the portal, go to Diagnostic Settings and add make sure you are sending your SQL Requests to your Log Analytics workspace. The sys.dm_pdw_exec_requests view in your SQL pool correlates with the SynapseSqlPoolExecRequests table when sent to Log Analytics.

    69915-image.png


Your answer

Answers can be marked as Accepted Answers by the question author, which helps users to know the answer solved the author's problem.