' cx='32' cy='32' r='32' /%3E%3Ctext x='50%25' y='55%25' dominant-baseline='middle' text-anchor='middle' fill='%23FFF' %3EDT%3C/text%3E%3C/svg%3E)
152 questions
' cx='32' cy='32' r='32' /%3E%3Ctext x='50%25' y='55%25' dominant-baseline='middle' text-anchor='middle' fill='%23FFF' %3EOF%3C/text%3E%3C/svg%3E)
' cx='32' cy='32' r='32' /%3E%3Ctext x='50%25' y='55%25' dominant-baseline='middle' text-anchor='middle' fill='%23FFF' %3ETJ%3C/text%3E%3C/svg%3E)


Dave,
So in your chart1.xml, you actually only have two labels defined, "Approved" and "Available". When I ask Microsoft Word's UI to "show the labels for the data points", it actually has to add all the individual data point labels like this:
            <c:dLbl>
              <c:idx val="1"/>
              <c:delete val="1"/>
              <c:extLst>
                <c:ext xmlns:c15="http://schemas.microsoft.com/office/drawing/2012/chart" uri="{CE6537A1-D6FC-4f65-9D91-7224C49458BB}"/>
                <c:ext xmlns:c16="http://schemas.microsoft.com/office/drawing/2014/chart" uri="{C3380CC4-5D6E-409C-BE32-E72D297353CC}">
                  <c16:uniqueId val="{00000004-09EB-4C88-9E2A-9B38D3E6DFC7}"/>
                </c:ext>
              </c:extLst>
            </c:dLbl>
            <c:dLbl>
              <c:idx val="2"/>
              <c:delete val="1"/>
              <c:extLst>
                <c:ext xmlns:c15="http://schemas.microsoft.com/office/drawing/2012/chart" uri="{CE6537A1-D6FC-4f65-9D91-7224C49458BB}"/>
                <c:ext xmlns:c16="http://schemas.microsoft.com/office/drawing/2014/chart" uri="{C3380CC4-5D6E-409C-BE32-E72D297353CC}">
                  <c16:uniqueId val="{00000005-09EB-4C88-9E2A-9B38D3E6DFC7}"/>
                </c:ext>
              </c:extLst>
            </c:dLbl>
            <c:dLbl>
              <c:idx val="3"/>
              <c:delete val="1"/>
              <c:extLst>
                <c:ext xmlns:c15="http://schemas.microsoft.com/office/drawing/2012/chart" uri="{CE6537A1-D6FC-4f65-9D91-7224C49458BB}"/>
                <c:ext xmlns:c16="http://schemas.microsoft.com/office/drawing/2014/chart" uri="{C3380CC4-5D6E-409C-BE32-E72D297353CC}">
                  <c16:uniqueId val="{00000006-09EB-4C88-9E2A-9B38D3E6DFC7}"/>
                </c:ext>
              </c:extLst>
            </c:dLbl>
....
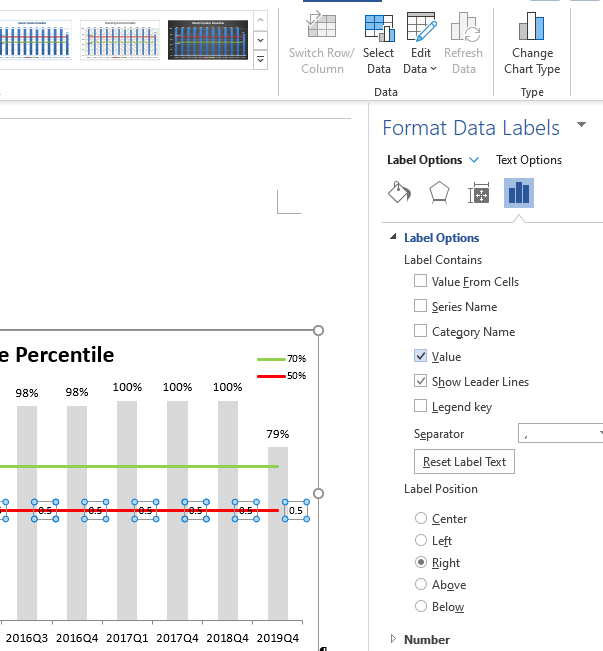
So above you see two of the 9 or 10 data point labels that Word adds. And you check by opening this in Word, selecting the series plot, formatting the data labels in the side bar and first unchecking then checking the "Value" checkbox. That causes Word to have to write out the XML to show all the labels. Like this:
Tom
P.S. I only posted this as an "Answer" post because I couldn't fit it in a comment. Feel free to respond if this doesn't answer your question.