' cx='32' cy='32' r='32' /%3E%3Ctext x='50%25' y='55%25' dominant-baseline='middle' text-anchor='middle' fill='%23FFF' %3EJ%3C/text%3E%3C/svg%3E)
46,326 questions


Hi @jdhbr
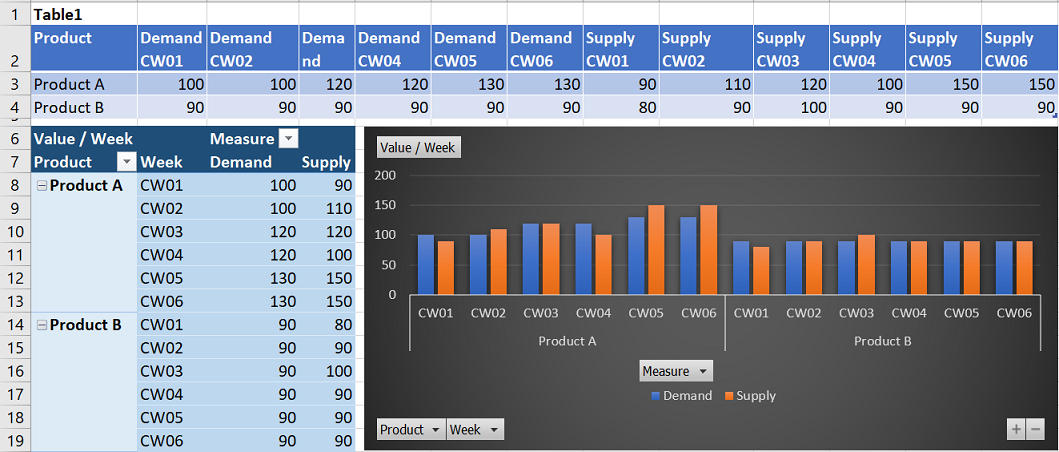
Done with Excel + PQ (works with Power BI Desktop). Assuming Table1 as below
Power Query code:
let
    Source = Excel.CurrentWorkbook(){[Name="Table1"]}[Content],
    ChangedTypes = Table.TransformColumnTypes(Source,
        {<!-- -->{"Product", type text}} &
        List.Transform(List.Difference(Table.ColumnNames(Source), {"Product"}),
            each {_, type number}
        )
    ),
    UnpivotedCWs = Table.UnpivotOtherColumns(ChangedTypes, {"Product"}, "Attribute", "Value"),
    SplittedAttribute = Table.SplitColumn(UnpivotedCWs, "Attribute",
        Splitter.SplitTextByEachDelimiter({" "}, QuoteStyle.Csv, false),
        {"Measure", "Week"}
    )
in
    SplittedAttribute
If you need help with Power BI Desktop let me know (not with the Chart though - not my cup of tea :)
EDIT Corresponding sample avail. here
