SQL Server Reporting Services
A SQL Server technology that supports the creation, management, and delivery of both traditional, paper-oriented reports and interactive, web-based reports.
This browser is no longer supported.
Upgrade to Microsoft Edge to take advantage of the latest features, security updates, and technical support.
' cx='32' cy='32' r='32' /%3E%3Ctext x='50%25' y='55%25' dominant-baseline='middle' text-anchor='middle' fill='%23FFF' %3EA%3C/text%3E%3C/svg%3E)
Hi All,
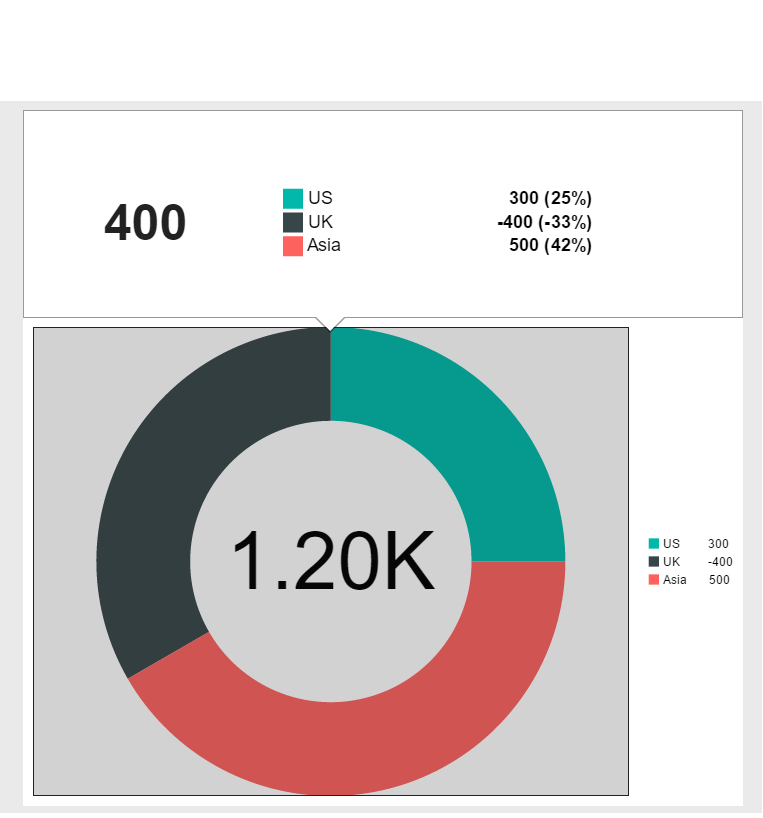
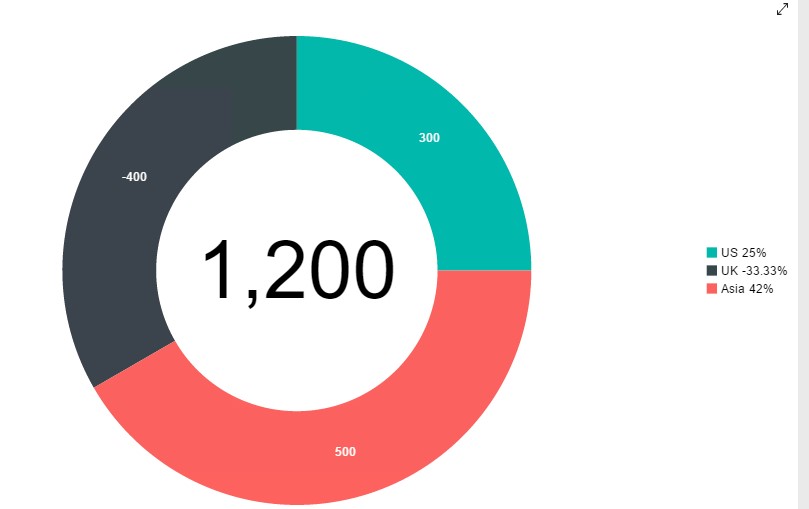
Recently I have noticed that the Donut Pie chart in Mobile reports with the totals in the center is not properly summing up negative values
Surprisingly the pop-up on the pie chart is displaying the totals correctly
Also, A negative percentage is being displayed for negative amounts in the pop-up which does not make sense as the percentage should be absolute.
Is there a way to fix this? or just avoid it from displaying any percentage?
Thanks in advance for your support.

Hi @Anonymous ,
I reproduced your issue which looks like a sum of absolute values. But pie charts are really not suitable for negative numbers, right? Pie charts are mainly used to describe the relative relationship between volume, frequency or percentage. For aggregation and display of positive and negative values, other forms of charts can be used.
I suggest you submit the requirement at https://feedback.azure.com/forums/908035-sql-server.
If the requirement mentioned by customers for many times, the product team may consider to add this feature in the next SQL Server version. Your feedback is valuable for us to improve our products and increase the level of service provided.
Best Regards,
Joy
If the answer is helpful, please click "Accept Answer" and upvote it.
Note: Please follow the steps in our documentation to enable e-mail notifications if you want to receive the related email notification for this thread.
Hi Joyzhao-MSFT,
Thanks for your prompt response.
I agree that Pie charts are rarely used for Negative numbers, and Bar charts are more preferred for this situation. But in Financial and Banking industry we have extensively used Pie charts in SSRS to display revenues with negative numbers.
The main issue is the inconsistency between the totals displayed in the pop-up (when you click on the chart) and the totals displayed in the center of the donut.
The total in the center of the donut chart sum's up the absolute values where as the Pop-up properly sum's up positive and negative values.
I would consider it as a bug in the tool.
Adding this feature to properly sum negative values in the center of the Donut Chart would be a huge plus for Mobile Reports as this would not impact other user's who always have absolute values. Other dashboard/reporting tools already have this feature available.
I would definitely submit this requirement in the link you provided above.
Thanks a lot for your help.
Thanks for your feedback. I am looking forward to the pie chart problem being resolved as soon as possible.
Regards,
Joy