Azure Sphere
An Azure internet of things security solution including hardware, operating system, and cloud components.
157 questions
This browser is no longer supported.
Upgrade to Microsoft Edge to take advantage of the latest features, security updates, and technical support.
' cx='32' cy='32' r='32' /%3E%3Ctext x='50%25' y='55%25' dominant-baseline='middle' text-anchor='middle' fill='%23FFF' %3EMR%3C/text%3E%3C/svg%3E)
I want to make application consisting of two RTApps on AVNET Azure Sphere Starter Kit (rev1) platform with MT3620. I want to debug both applications at the same time using Visual Studio. I opened two Visual Studios and started debugging of one app. It worked. Then I started debuging of second app in second Visual Studio but folowing error occured:
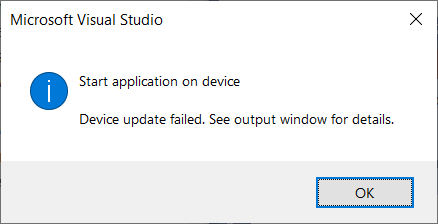
after confirming dialog a new dialog appeared:
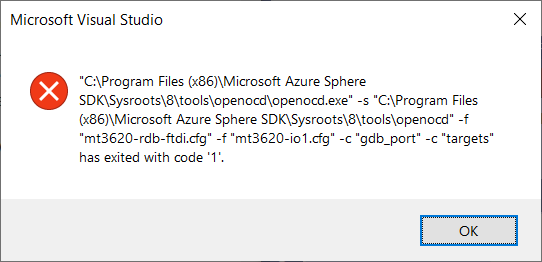
At the same time OpenOCD output was printed to Output window to "Device Update" output pane with following content:
Copying application to the device
Device update succeeded.
Launching On-Chip Debugger: "C:\Program Files (x86)\Microsoft Azure Sphere SDK\Sysroots\8\tools\openocd\openocd.exe" -s "C:\Program Files (x86)\Microsoft Azure Sphere SDK\Sysroots\8\tools\openocd" -f "mt3620-rdb-ftdi.cfg" -f "mt3620-io1.cfg" -c "gdb_port" -c "targets"
Open On-Chip Debugger 0.10.0+dev-01288-g5a79481d3-dirty (2021-01-04-20:24)
Licensed under GNU GPL v2
For bug reports, read
 http://openocd.org/doc/doxygen/bugs.html
DEPRECATED! use 'adapter driver' not 'interface'
Info : FTDI SWD mode enabled
DEPRECATED! use 'adapter speed' not 'adapter_khz'
force hard breakpoints
4444

    TargetName         Type       Endian TapName            State
--  ------------------ ---------- ------ ------------------ ------------
 0* io1                cortex_m   little mt3620.cpu         unknown

Info : Listening on port 6666 for tcl connections
Info : telnet server disabled
Error: libusb_open() failed with LIBUSB_ERROR_ACCESS
Error: no device found
Error: unable to open ftdi device with vid 0403, pid 6011, description 'MSFT MT3620 Std Interface', serial '*' at bus location '*'

"C:\Program Files (x86)\Microsoft Azure Sphere SDK\Sysroots\8\tools\openocd\openocd.exe" -s "C:\Program Files (x86)\Microsoft Azure Sphere SDK\Sysroots\8\tools\openocd" -f "mt3620-rdb-ftdi.cfg" -f "mt3620-io1.cfg" -c "gdb_port" -c "targets" has exited with code '1'.
"C:\Program Files (x86)\Microsoft Azure Sphere SDK\Sysroots\8\tools\openocd\openocd.exe" -s "C:\Program Files (x86)\Microsoft Azure Sphere SDK\Sysroots\8\tools\openocd" -f "mt3620-rdb-ftdi.cfg" -f "mt3620-io1.cfg" -c "gdb_port" -c "targets" has exited with code '1'. (Exception)
The most interesting part of output is
Error: libusb_open() failed with LIBUSB_ERROR_ACCESS
Error: no device found
Error: unable to open ftdi device with vid 0403, pid 6011, description 'MSFT MT3620 Std Interface', serial '*' at bus location '*'
I tried switchng order of starting apps and I always can debug first app and second app crashes with error. From outputs I see that Visual Studio correctly attemped to use io0 config and io1 when starting second app. I also tried start both Visual Stduios as Administrator but nothing changed. Have you any idea how to resolve this libsub issue to be able debug both apps at once?
' cx='32' cy='32' r='32' /%3E%3Ctext x='50%25' y='55%25' dominant-baseline='middle' text-anchor='middle' fill='%23FFF' %3EAM%3C/text%3E%3C/svg%3E)
@Michal Žůrek Community SME's on this topic or our team will review your scenario and circle back at the possible earliest time.
@Michal Žůrek Just to confirm, have you followed this doc to Build a real-time capable application?
As mentioned in the Troubleshoot real-time capable applications page, have you tried debugging one app at a time?

Also, see Lost connection to non-Azure Sphere FTDI devices after enabling RTApp debug and let us know if that helps.
Thank you for answer. I followed article mentioned by you and I tried debug only one RTApp at time and this works, but I need to debug two RT apps at the same time, so I am worrying about how to make first part of marked sentense working. I have connected only one FTDI device in my system. I see three UARTs which are managed by FTDI driver version 2.12.28.0 and one MSFT MT3620 Std Interface device managed by driver with version specified as 0.0.0.0 and built at 2021-01-28


Thanks for the further information. We are looking into this issue and update you as earliest. Appreciate your time and patience.
@Michal Žůrek Did you get a chance to see Chandra's response? Let us know if that helps or needs further assistance.
' cx='32' cy='32' r='32' /%3E%3Ctext x='50%25' y='55%25' dominant-baseline='middle' text-anchor='middle' fill='%23FFF' %3EC%3C/text%3E%3C/svg%3E)
@Michal Žůrek - Debugging 2 RTApps is not supported due to Visual Studio dependencies. To debug multiple RT cores, you will need to start and stop from the same IDE.
We appreciate you sharing the use-case scenario. We are looking into how this scenario can be enabled in the upcoming releases. Thank you!
Hello. Thank you for answer. Are there any plans when we can expect support for debugging two RT apps at once (weeks, months or years)?
' cx='32' cy='32' r='32' /%3E%3Ctext x='50%25' y='55%25' dominant-baseline='middle' text-anchor='middle' fill='%23FFF' %3EMG%3C/text%3E%3C/svg%3E)
The root cause here is that OpenOCD which is used for debugging to the RT cores takes the entire USB transport so you cannot connect again from a second instance of VS/VSCode.
The way to debug both cores is by putting both RT apps under the same top level directory, and adding a top-level "launch.vs.json" like we do in [IntercoreComm sample][1]. The relevant line is "targetCore": "AnyCore" -- that tells Visual Studio to simultaneously deploy and debug both cores.
We are not working on enabling multiple instances of VS to debug different RT cores as this would require changes to OpenOCD.
' cx='32' cy='32' r='32' /%3E%3Ctext x='50%25' y='55%25' dominant-baseline='middle' text-anchor='middle' fill='%23FFF' %3EBW%3C/text%3E%3C/svg%3E)
@Michal Žůrek , have you tried to use debug output from the real-time application(s) over the dedicated M4 UART TX signals? This is not as nice as having a gdb debugger, but it's better than working in the dark.
The dedicated M4 UART TX signals are exposed on the Avnet Starter Kits at location J11.
Yes I did. I developed my app in a way that I was debugging using GDB one app at time. I used LEDs and Tx only debug UART for "debugging" second app at the same time. For now I reccommend configuring targetCore to AnyCore for debugging both apps at once as mentioned by Marc Goodner in comment https://learn.microsoft.com/en-us/answers/questions/313463/azure-sphere-debugging-two-rtapps-at-once-fails-wi.html?childToView=375778#comment-375778