Hello everyone,
I'm diving into DAX measures and, being my second try at DAX, I have an issue with the meassures that I don't understand, or DAX, really, for that matter.
Sample file: https://1drv.ms/x/s!AmrjlXSYqMxegZo7priwmzmmcLgfrA?e=axmzpO
Disclosure: data is publicly available information accesible from the Central Bank's website to internet users from all over the world. Original data is in Spanish and it's quite a bit to translate by myself. hope this won't be an issue. The data in the file is a sample, the actual data set is much, much bigger.
Issue:
I wish to create a data model that will allow me to quickly analize my country's insurance market. But I have 3 different markets, that need to be calculated and is why I wish to create a DAX measure for each.
How I got here:
a) After importing the data and transforming it through power query, I have the resulting table "Resultado_Técnico", viewble in the file at the "Resultado Técnico" sheet. This is the facts table. (For the sample file I've broken the original connection to avoid posible errors and simply left a sample table)
b) Created 3 dimension tables:
- "tbl_cia", viewable at the "Tabla Compañías" sheet, represents the companies that operate in the market. Note: the company "CONSOLIDADO" or "MERCADO" is
the market itself.
- "tbl_cuentas", viewable at the "Tabla Cuentas" sheet, represents the accounts into wich the financial information is organized. Note: the account "Primas emitidas
netas de anulacs." is the gross written premiums, how the output/production is meassured in the insurance industry.
- "tbl_ramas", viewable at the "Tabla Ramas" sheet, represents the lines of business the market is segmented into. Note: the line of business "Total" is
the market itself.
c) Uploaded the facts table and the dimension tables to the data model.
d) Added a 4th dimension table, Calender, renamed "tbl_fechas".
e) Created the DAX measures, all located in the "Resultado_Técnico", or facts table, of the data model.
- "Mercado total", this represents the total market through the sum of written premiums, the account name is "Primas emitidas netas de anulacs."
- "Mercado abierto", this represents the open market through the sum of written premiums, the account name is "Primas emitidas netas de anulacs.", of some
"ramas", lines business that segment the market, that are available to all privately owned companies. Some segments are only exploited by the state owned
company, "BSE", for reasons that are not to the poinf of the issue.
- "Mercado en competencia", this represents the market segments in which the company I work at operates, through the sum of written premiums, the account name
is "Primas emitidas netas de anulacs.".
f) A ranking measure for the different markets explained at e).
Open market excludes the following lines of business:
-Accidentes
-Invalidez
-Reaseguros Activos
-Seguro Colectivo
-Seguro de Renta Vitalicia
-Vida Prev.
Market in which my company operates excludes the following lines of business:
-Accidentes
-Invalidez
-Reaseguros Activos
-Seguro Colectivo
-Seguro de Renta Vitalicia
-Vida Prev.
-Accidente
-Caución
-Crédito
-Ingeniería
-Invalidez
-Robo
-Rurales
-Salud
-Vida Colectivos (RM)
-Vida individual (NRM)
-Vida individual (RM)
Problem:
In the sheet "Mercado por cia 2020", Market by companies in 2020, the measures work as expected and in a single pivot table, with the companies in the rows and lines of busniess in the columns, to filter for "Total" (I tried applying this filter at the measure, but then the pivot table would only show the grand total at every row), and the 3 measures in the values. The measure "Rank" works as well.
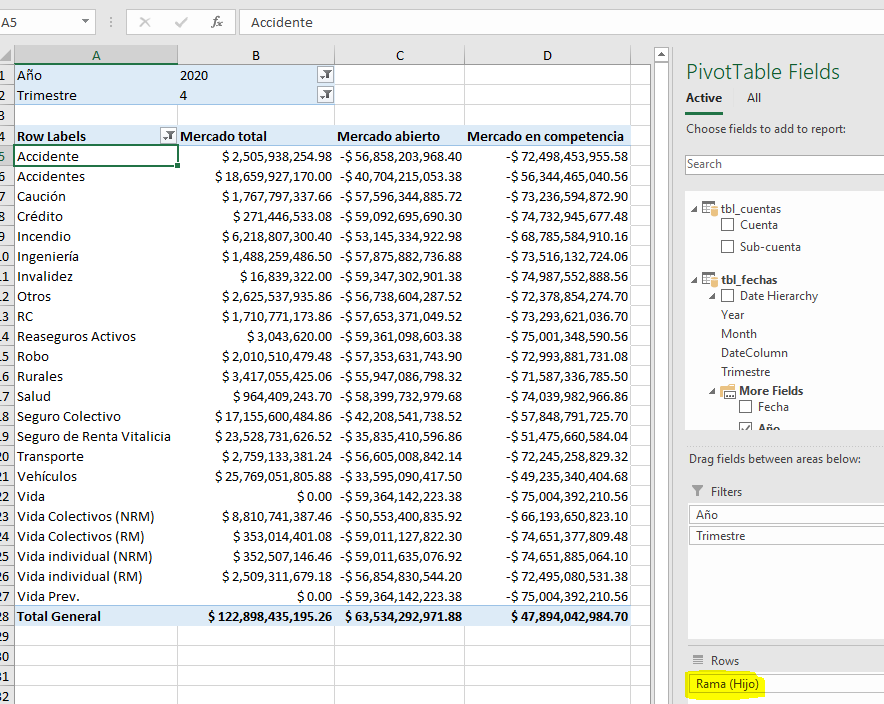
However, in the sheet "Mercado por rama 2020", Market by line of business 2020, the measures don't work as expected. The idea of the pivot table in this sheet is to have the lines of business in the rows and the companies in the column, to filter for "MERCADO", the market itself, and the the 3 measures in the values.
Now, "Mercado total", total market, does work, but the other two, "Mercado abierto", open market, and "Mercado en competencia", the market in which my company operates, show negative values at every row that I dont understand, but the pivot table's Grand Total shows the correct value.
In the same sheet I've added three pivot tables created only from the facts table that show the expected results for each meassure. For reporting purposes, I wish to have this in a single pivot table.
Is there a way to make this work for the pivot table at the sheet "Mercado por rama 2020" like it works for the pivot table at the sheet "Mercado por cia 2020"?
I'm at my wits end, with my limited experience.
Thanks in advance,
Shinka
' cx='32' cy='32' r='32' /%3E%3Ctext x='50%25' y='55%25' dominant-baseline='middle' text-anchor='middle' fill='%23FFF' %3ES%3C/text%3E%3C/svg%3E)

' cx='32' cy='32' r='32' /%3E%3Ctext x='50%25' y='55%25' dominant-baseline='middle' text-anchor='middle' fill='%23FFF' %3ELY%3C/text%3E%3C/svg%3E)