' cx='32' cy='32' r='32' /%3E%3Ctext x='50%25' y='55%25' dominant-baseline='middle' text-anchor='middle' fill='%23FFF' %3EB%3C/text%3E%3C/svg%3E)
3,917 questions
' cx='32' cy='32' r='32' /%3E%3Ctext x='50%25' y='55%25' dominant-baseline='middle' text-anchor='middle' fill='%23FFF' %3EEM%3C/text%3E%3C/svg%3E)

@BD2009
Could you please explain that how did you get the value of "Avg of I1 accts" and "Avg of I2 accts"?
Will the number of occurrences of each account be counted?
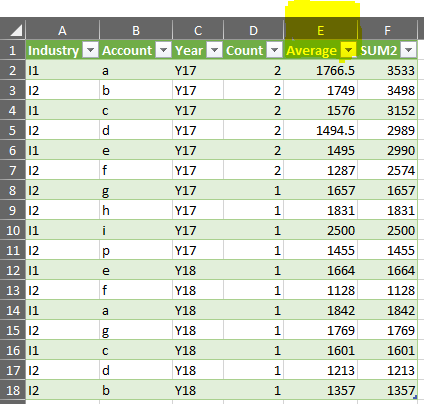
If you want to achieve your needs via Pivot Table, we need to count the "Qtrs" numbers for every account and every year, like the following table (I got it via Power Query), but it is hard to create a relationship between this table and your source data.
More detailed information, please refer to "Relationships between tables in a Data Model" and "Create a relationship between tables in Excel".
I would suggest you handle your flat data via formulas or Power Query first.
Here is a similar sample I created as yours, and I added a column of "Year", such as "Y17", "Y18". Then I use formula to get the data that I want for every account and every Year, such as "SUM-Y17", "CountY17".
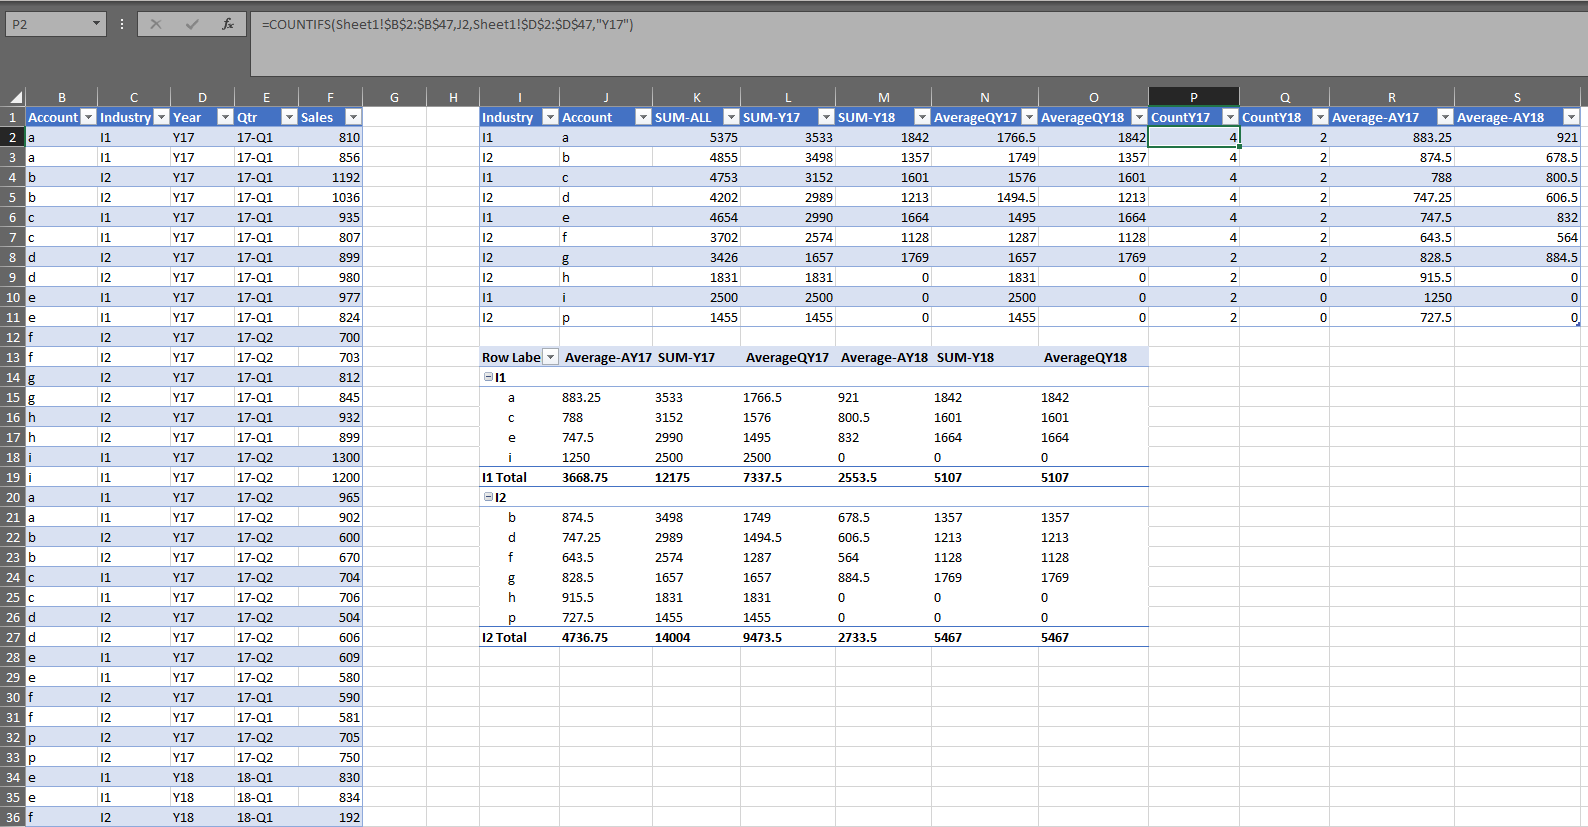
But if you need Column labels for year and quarter in pivot table, I suggest you create 2 pivot tables and put them together.
Any updates, you may share with us.
If an Answer is helpful, please click "Accept Answer" and upvote it.
Note: Please follow the steps in our documentation to enable e-mail notifications if you want to receive the related email notification for this thread.