Hi David
Here is what I found out.
- How can customer get the consistent z-order between Chart and rendered in PDF.
I understand that the rendering order is important for the customer's scenario. I don't believe that this "order" attribute is relevant though, as it only seems to matter for series which are filtered out (and hence, invisible). The order the series should be rendered in is the order in which they appear in the file.
- How does chart really handle <c:order val="0"/>, it appeared it would get ignore under some scenarios.
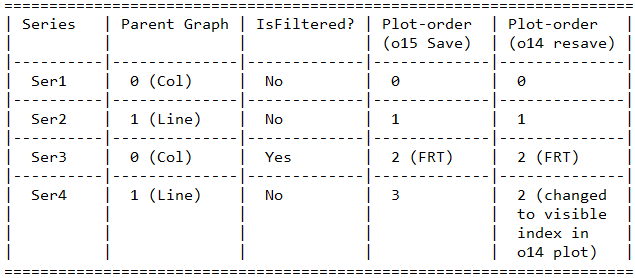
The bug is found in the Office15, interaction between order and filtered/non-filtered series:
" HrCommitFilteredSeries:
This function commits all the filtered out series loaded from all the graphs
in this plot, in the order of their saved-out plot-order index (saved as
"xmltkOrder" on the series). This logic is necessary due to the following
scenario:
Consider a chart with 4 series in a combo-chart with column and line type
(2 Graphs : Graph 0 = Column, Graph 1 = Line). We filter out some series, and
save this file. Then we re-open it in o14 and save again. The original plot
orders when saving in o15 and then re-saving in o14 are summarized in the
table below.
Thus, we can't really load the entire column graph (Graph 0), before the line
graph, because then there would be a conflict in the plot order of Ser3 and Ser4.
What we do is load all the visible series from all the graphs, resulting
in a partially filled m_vserXLOrder array in the Plot.
For the above case, it would be:
0 : Ser1
1 : Ser2
2 : Ser3
Then we call this function to insert the filtered out series in their
expected location, starting from the one with lowest plot-order and going
in ascending order. At the end of this, our m_vserXLOrder would look like this:
0 : Ser1
1 : Ser2
2 : Ser3
3 : Ser4
because it will insert "Ser3" at index 2.
Let me know if this helped.
' cx='32' cy='32' r='32' /%3E%3Ctext x='50%25' y='55%25' dominant-baseline='middle' text-anchor='middle' fill='%23FFF' %3EDT%3C/text%3E%3C/svg%3E)