Azure App Service
Azure App Service is a service used to create and deploy scalable, mission-critical web apps.
6,908 questions
This browser is no longer supported.
Upgrade to Microsoft Edge to take advantage of the latest features, security updates, and technical support.
' cx='32' cy='32' r='32' /%3E%3Ctext x='50%25' y='55%25' dominant-baseline='middle' text-anchor='middle' fill='%23FFF' %3ECB%3C/text%3E%3C/svg%3E)
I have an Azure Web App that has been performing quite slow lately. My code has a few dependencies, and I am thinking that one of these such as SQL may be the cause for performance degradation. Is there any way from the Web App that I can confirm if one of these dependencies may be causing the issue?

If you have an application experiencing slow performance, one way to approach scoping this would be to use the Diagnose and solve problems blade in Portal (pictured below).
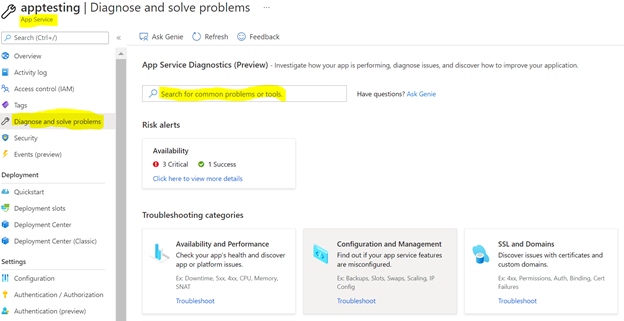
Here we can type into the search box “Web App Slow” which will list out your Top 5 Slowest Dependency Executions. When SQL may be an issue, the name field will have the word “database” within it.

Once this is seen, we can navigate to the SQL database and start looking at areas such as resource consumption (CPU, Memory), as well as seeing if we can optimize queries.
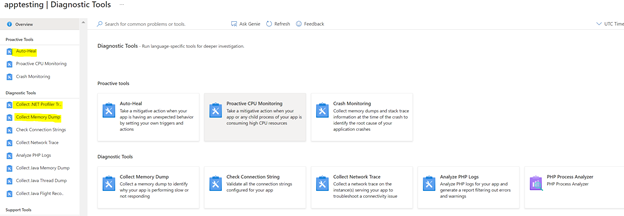
More verbose logging options such as Memory Dumps or .NET Profiler Traces which can be collected through Auto-Heal rules / manually can also lead to narrowing the issue down to SQL. These can be configured by navigating again to Diagnose and solve Problems -> Diagnostic Tools.
However, the initial recommendation of using the “Web App Slow” detector would be the quickest way to scope the issue, only using verbose logging as needed.